Part:BBa_K112808:Experience
This experience page is provided so that any user may enter their experience using this part.
Please enter
how you used this part and how it worked out.
Applications of BBa_K112808
Warning: This part is not RFC10 compatible
During Imperial College London's 2011 iGEM team's assembly of Gene Guard they encountered problems when cloning the holin-endolysin construct. They have found that there is an illegal XbaI site in the T4 Holin protein sequence. This was also found in the HQ's sequencing results but the RFC10 compatibility tag has not been removed from the front page of this part.
In our experience, (using the DNA supplied in the 2012 kit), standard assembly following RFC10 works just fine. We have combined this part with a pBAD strong promoter (Bba_K206000) and verified that it works. - NTNU iGEM 2012.
Using the Lysis Cassette BBa_K112808 To Recover DNA
Introduction
The 2011 EPFL iGEM team setup an information processing system that recovers DNA from cells in which a strong binding affinity exists between a particular transcription factor and its promoter. More specifically, our system looks at the interaction between the TetR transcription factor (TF) and its promoter pTet. If the interaction between these two is strong, the system will induce lysis in the cell. As a result of the lysis, the supernatant will contain the plasmids with the sequences for the transcription factor and the promoter. The information processing part comes in when one is interested in finding mutant transcription factor sequences and/or mutant promoter sequences with weaker or stronger binding affinities than the wildtype. In such a case, our system is ideal since a whole culture of cells -- each containing different plasmids with random combinations of mutant TFs and mutant promoters -- can be grown and the lysis will select the cells whose binding affinity was strongest -- a "survival of the weakest" strategy. One need only sample the supernatant and run through the system a few more times to select the best binding sequences of your favorite transcription factor and promotor.
Lysis Characterization
Introduction
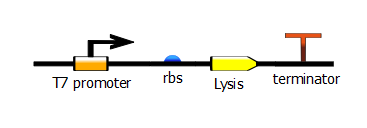
We cloned the Berkeley Lysis cassette (BBa_K112808) under control of the T7 promoter into a low copy number plasmid (pSB3K1).
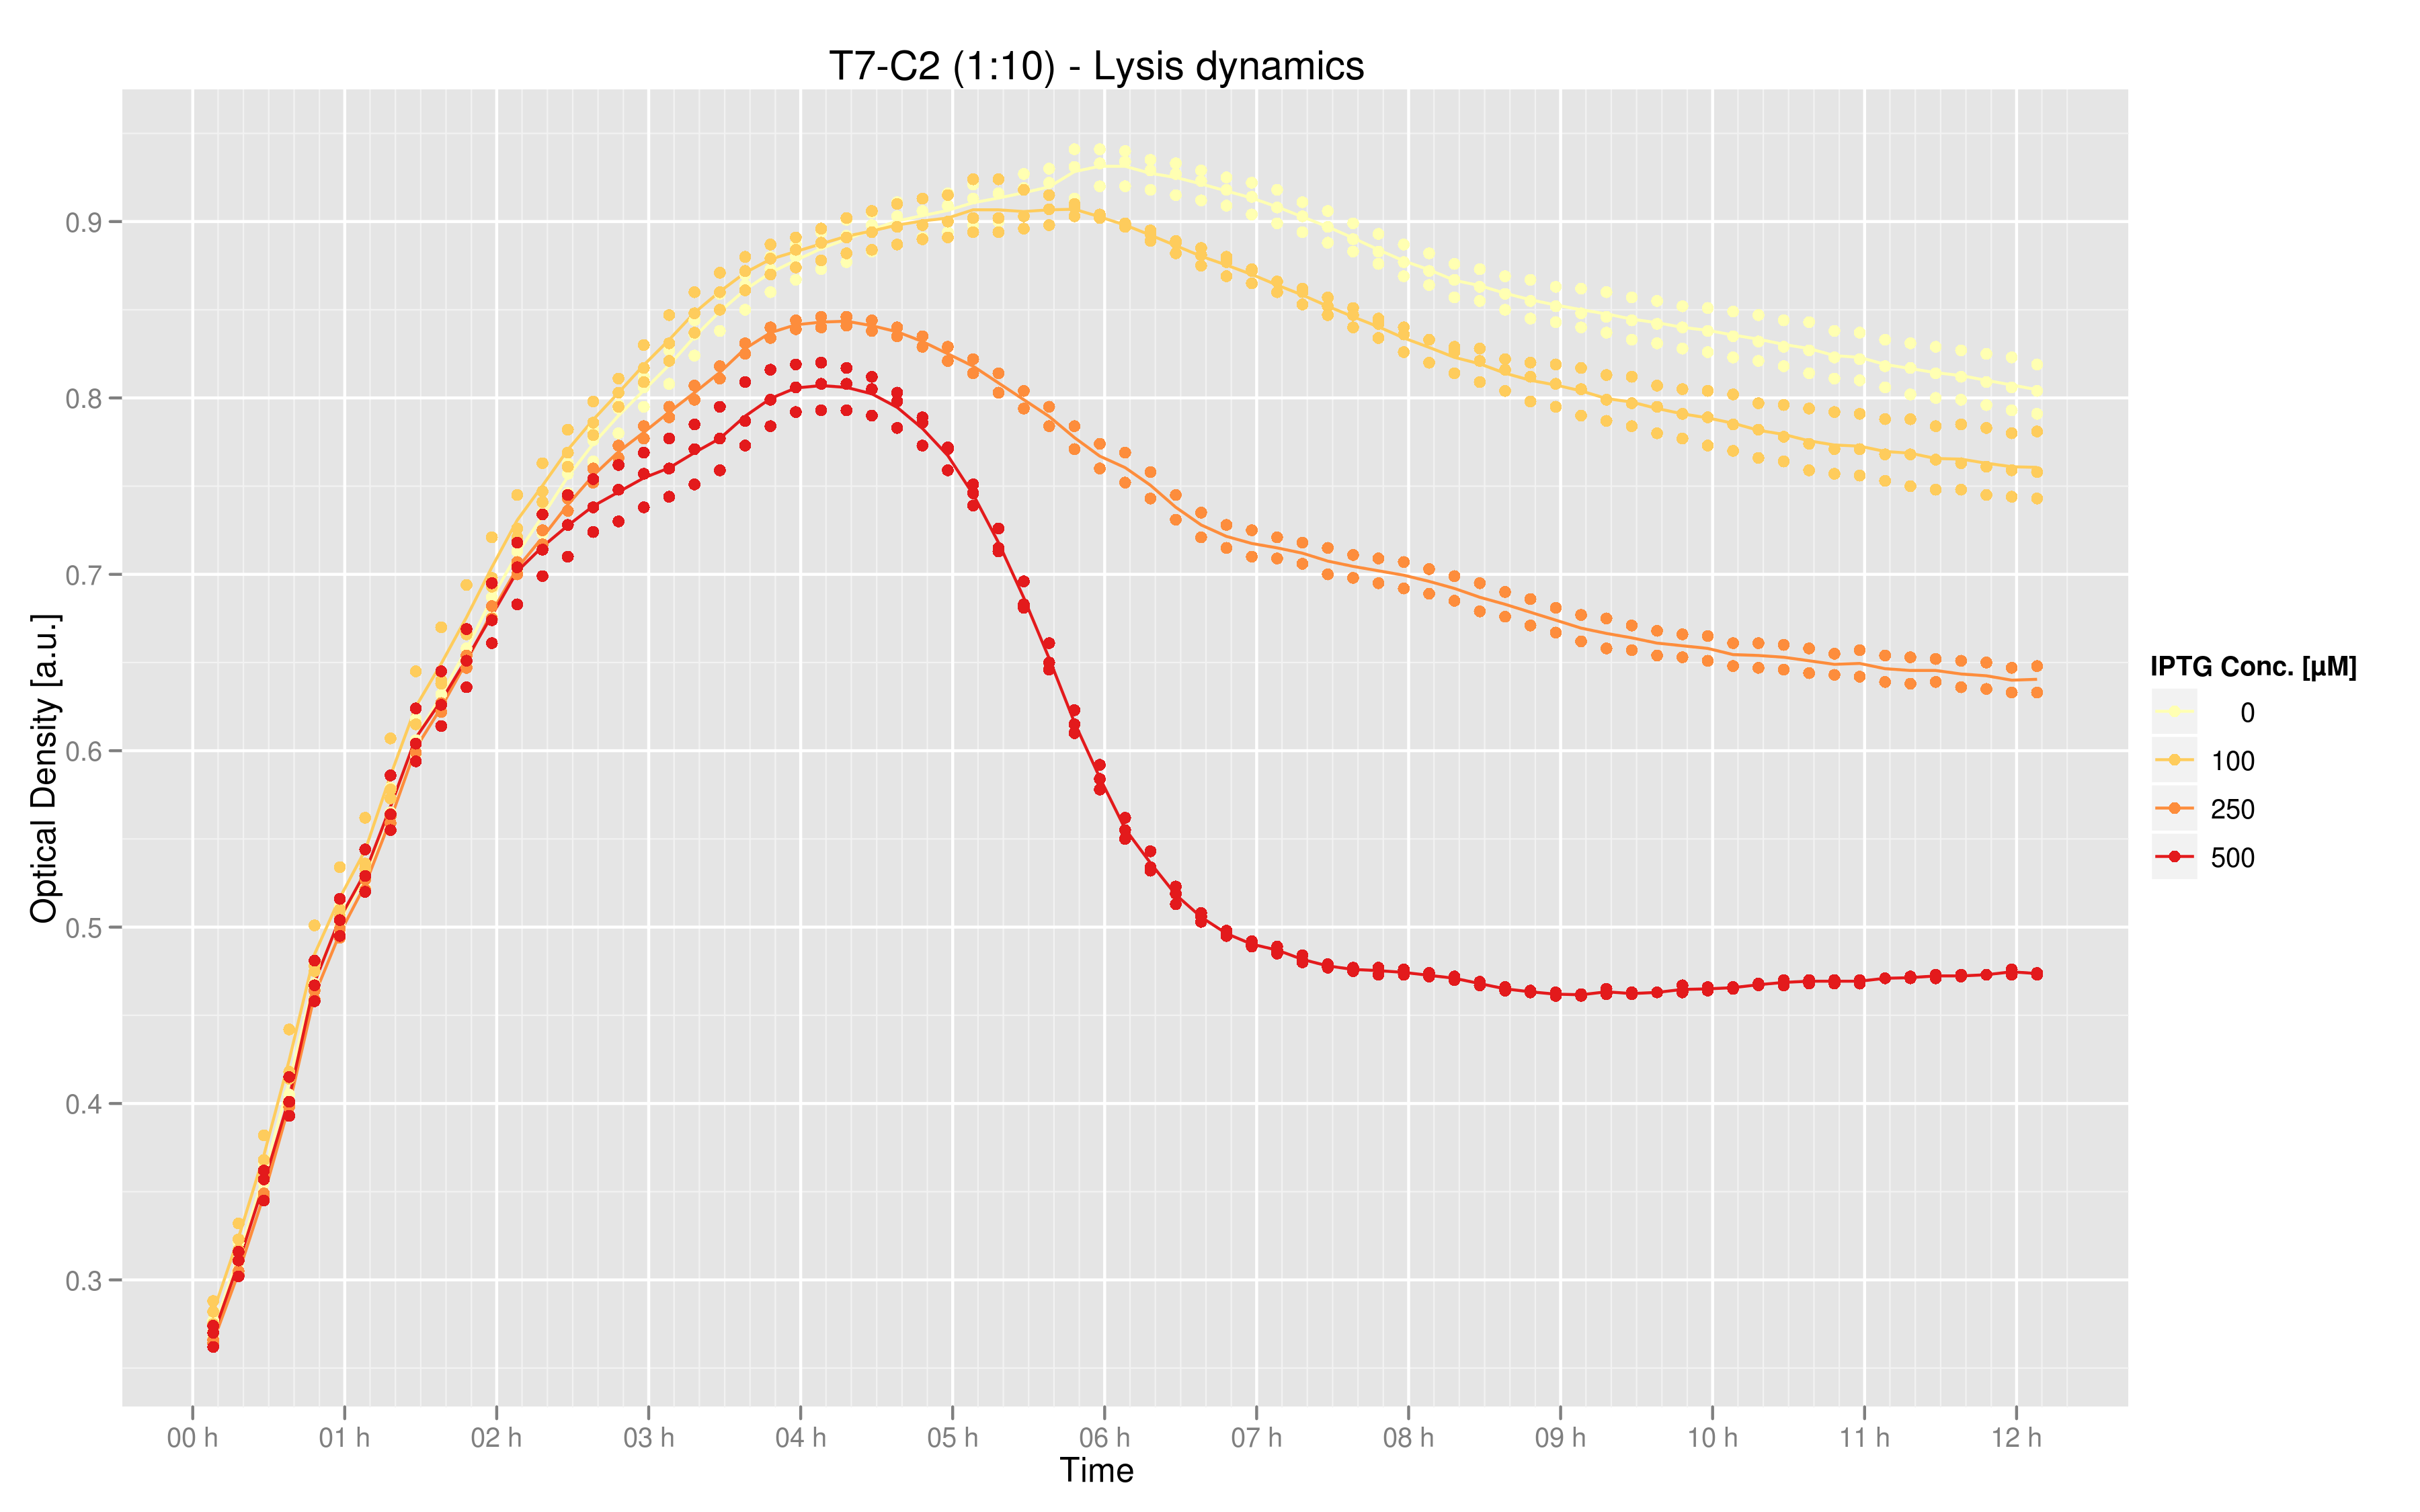
We tested lysis of cells haboring this plasmid in a platereader experiment. Lysis resulted in a drop in optical density after induction with IPTG. We observed a strong dependence on IPTG concentration.
To learn more about how IPTG induction tests work, click here.
Experimental Setup
1) We made liquid cultures of BL21 cells containing the plasmids with the lysis cassette driven by a T7 promoter. These plasmids have Kanamycin resistance, so the cultures were made using 5 mL of LB medium with 5 uL of 50 ug/uL Kanamycin and grown overnight.
2) 1:10 dilutions of cells to LB medium were made by adding 100 uL of cells to 900 uL of LB with 1 uL of Kanamycin. From this 1 mL mix, we pipetted 100 uL into the wells of a 96 well plate.
3) Each well was covered with 20 uL of mineral oil to avoid evaporation. Then we set the platereader to shake continuously and take optical density measurements at 600 nm wavelength every ten minutes.
4) We waited an hour and a half (approximately) until the cells had reached their log-linear growth phase. Then we took out the plate and added 1 uL of IPTG to each well. We made triplicate data for each concentration of IPTG (0 uM for negative control, 50 uM, 100 uM, 250 uM, and 500 uM).
5) The plate was set again into the platereader, where we ran it for 12 hours with continous shaking. Optical density measurements were made every ten minutes.
Results
Data was produced in triplicate via the 96 well plate. This graphic shows the mean over the three data points for the measurements taken every 10 minutes, with the exception of the 250 uM curve for which only two data points were available for the time evolution. The values on the y-axis are optical density (OD) at 600nm, while the x-axis represents time. The curves indicate that maximal lysis is produced with 500 uM IPTG, and that lesser degrees of lysis can be obtained with smaller doses of IPTG.
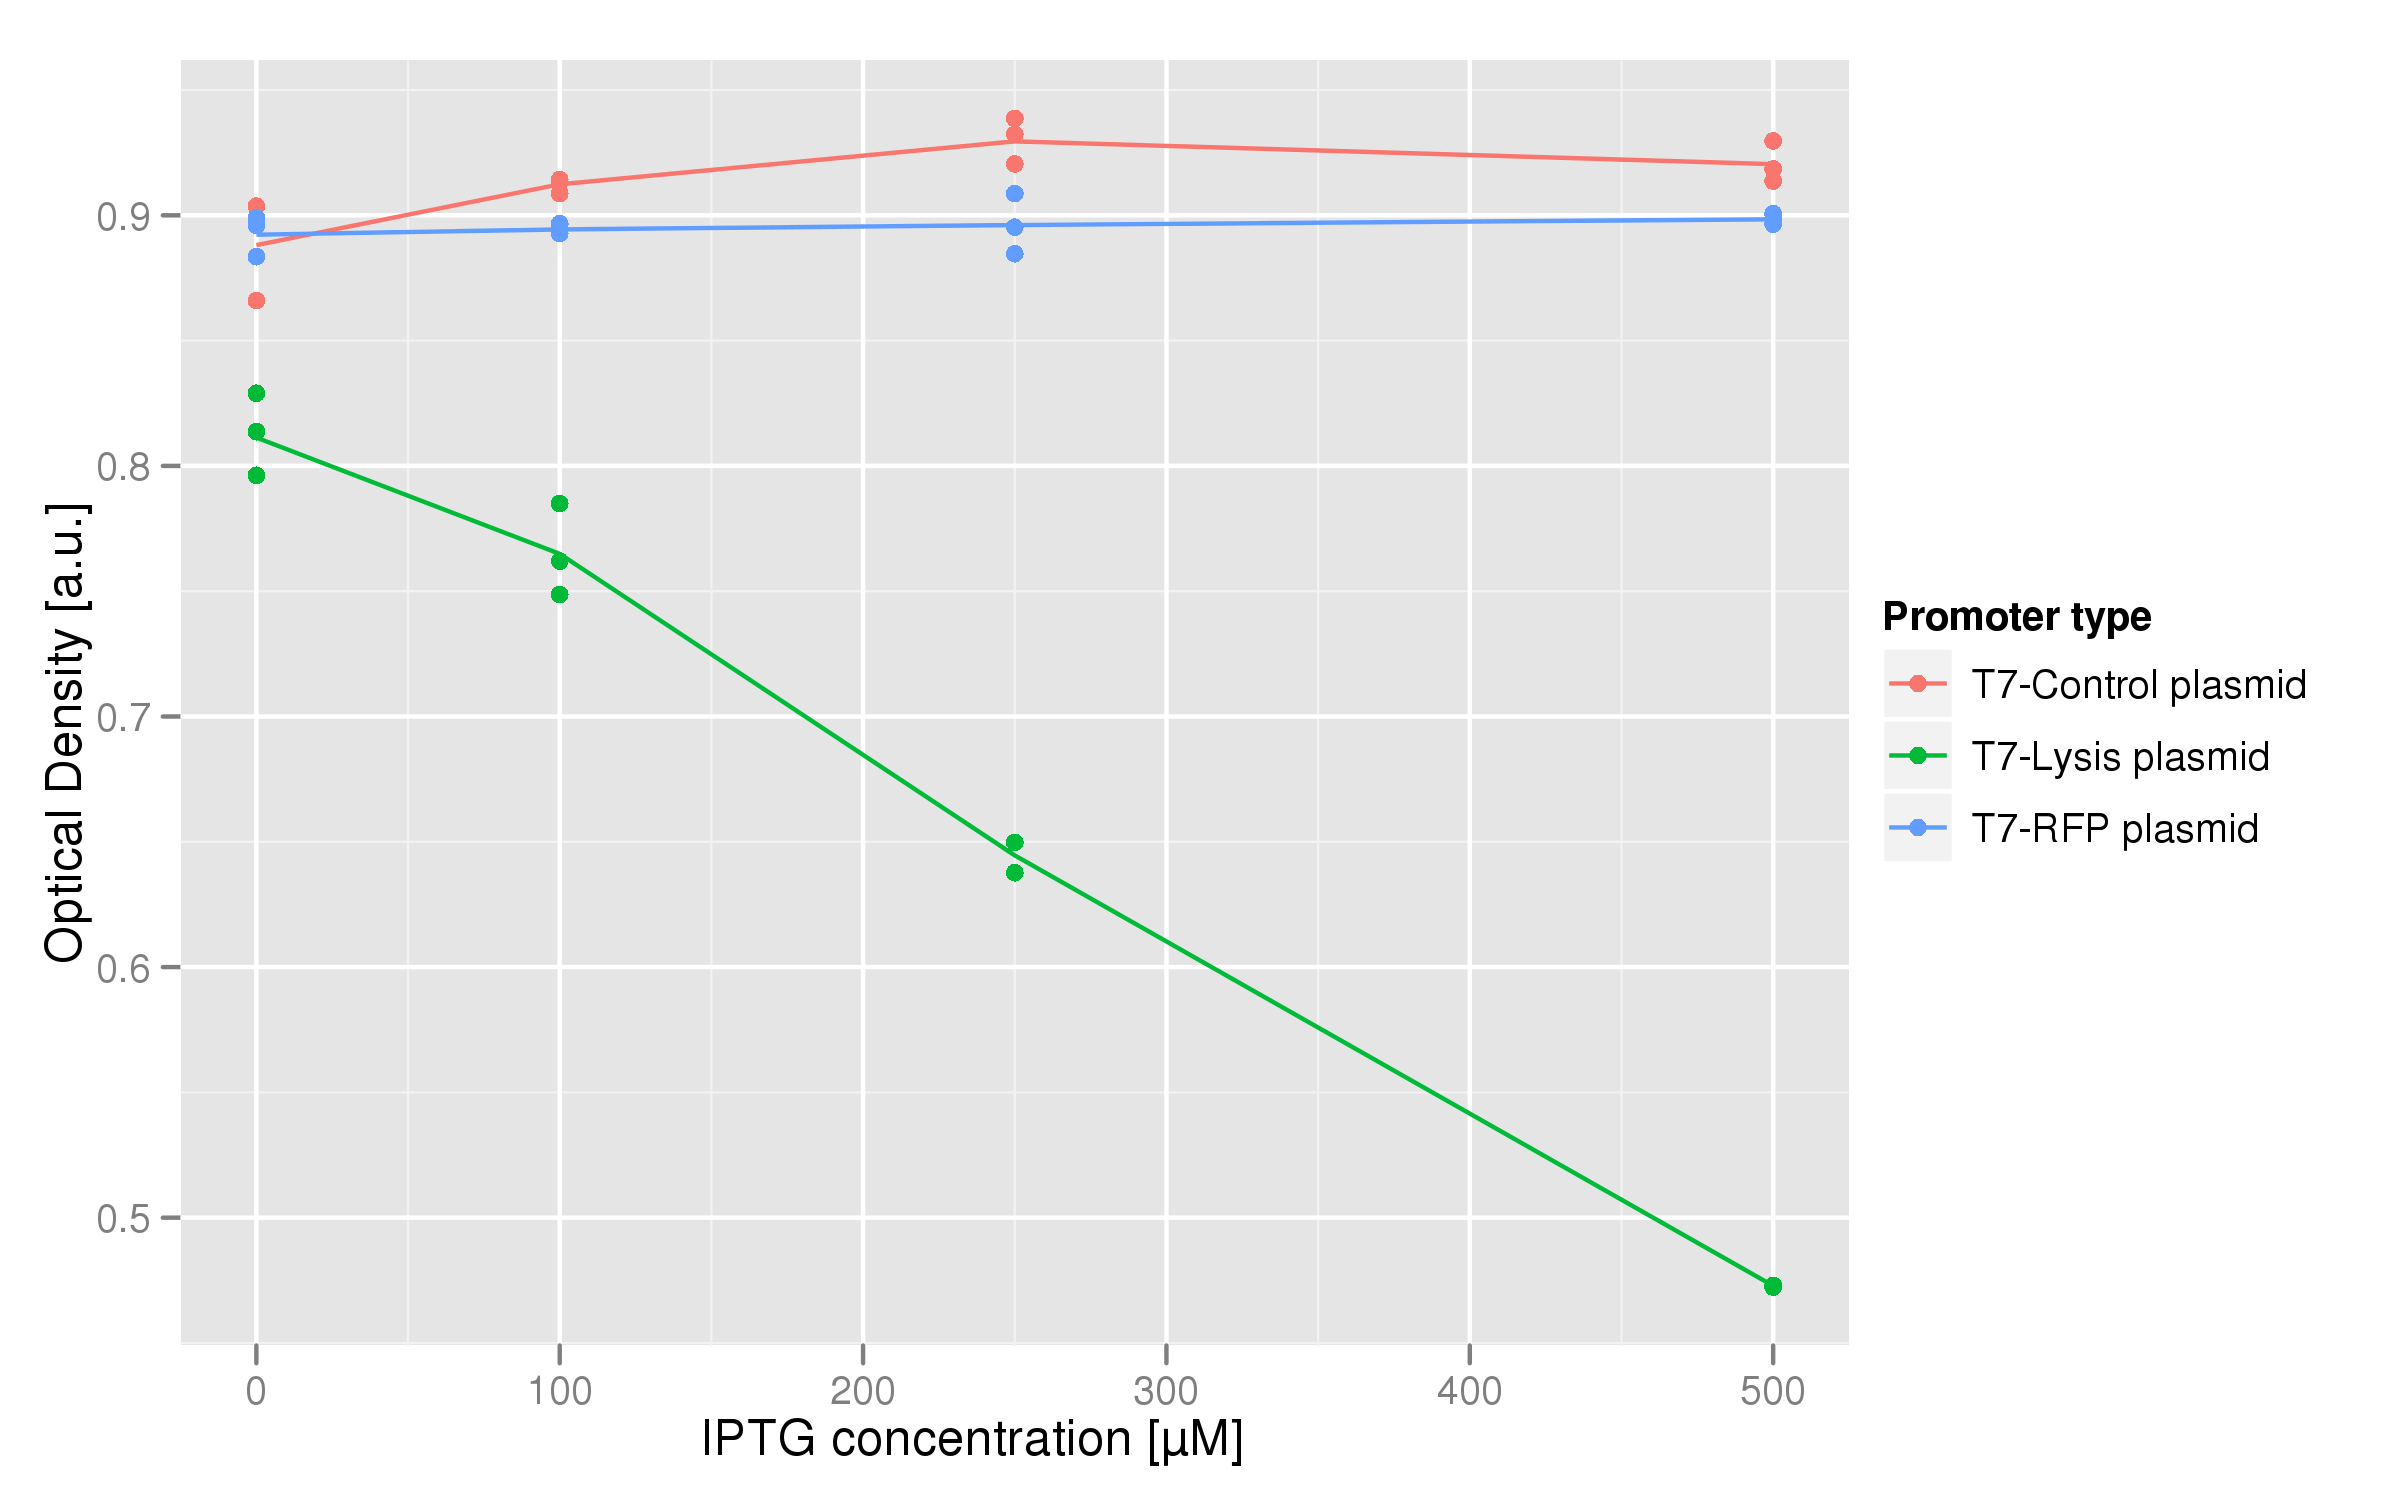
The dose-response graph above was also made using triplicate data. This time, the functional T7-lysis plasmid (C2) was tested against two negative controls: a T7-RFP plasmid (which should only fluoresce, not lyse) and a plasmid containing a non-functional lysis cassette driven by a T7 promoter (C11). The points of each curve are the OD values of each replicate averaged over the last hour of the experiment. For the lysis plasmid we observed a strong lysis response with increasing IPTG concentrations. Both controls show no significant change in endpoint OD in respect to IPTG concentration.
DNA Recovery
Introduction
We wanted to find out if cells release their plasmid DNA into the culture supernatant when they lyse and if we can recover this DNA for further analyses.
Experimental Setup
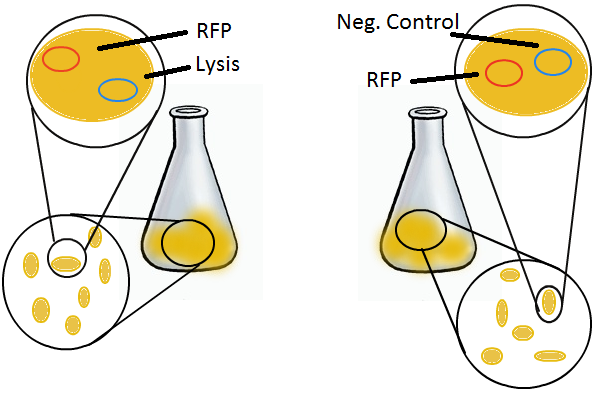
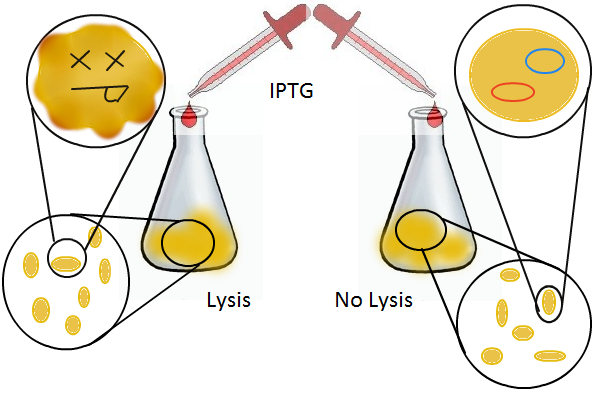
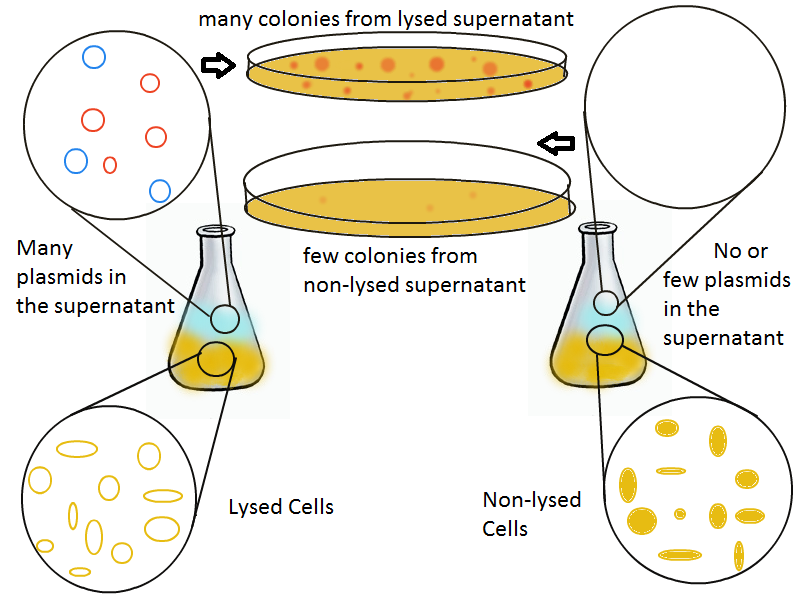
We grow two large cultures of cells. One contains cells that will lyse and release plasmids into the supernatant while the other has non-lysing cells containing a control (empty) plasmid. Adding IPTG to both flasks induces lysis in one set of cells but not in the others.
Once lysis has been induced, we harvest the supernatant every hour, centrifuge it, and sterile filter it in order to remove cell debris. With this purified supernatant, we proceed to two different methods for calculating the amount of DNA that was collected. One method uses the qPCR to amplify a particular sequence of DNA in the desired plasmid (in our case an RFP-containing plasmid). Depending on the cycle in which the qPCR first detects a PCR product, we can determine the plasmid concentration in the supernatant. The other method involves transforming the supernatant into competent cells and counting the number of resulting colonies. The colony count alongside the qPCR data gives a good understanding of how much DNA could be recovered from the supernatant.
Results
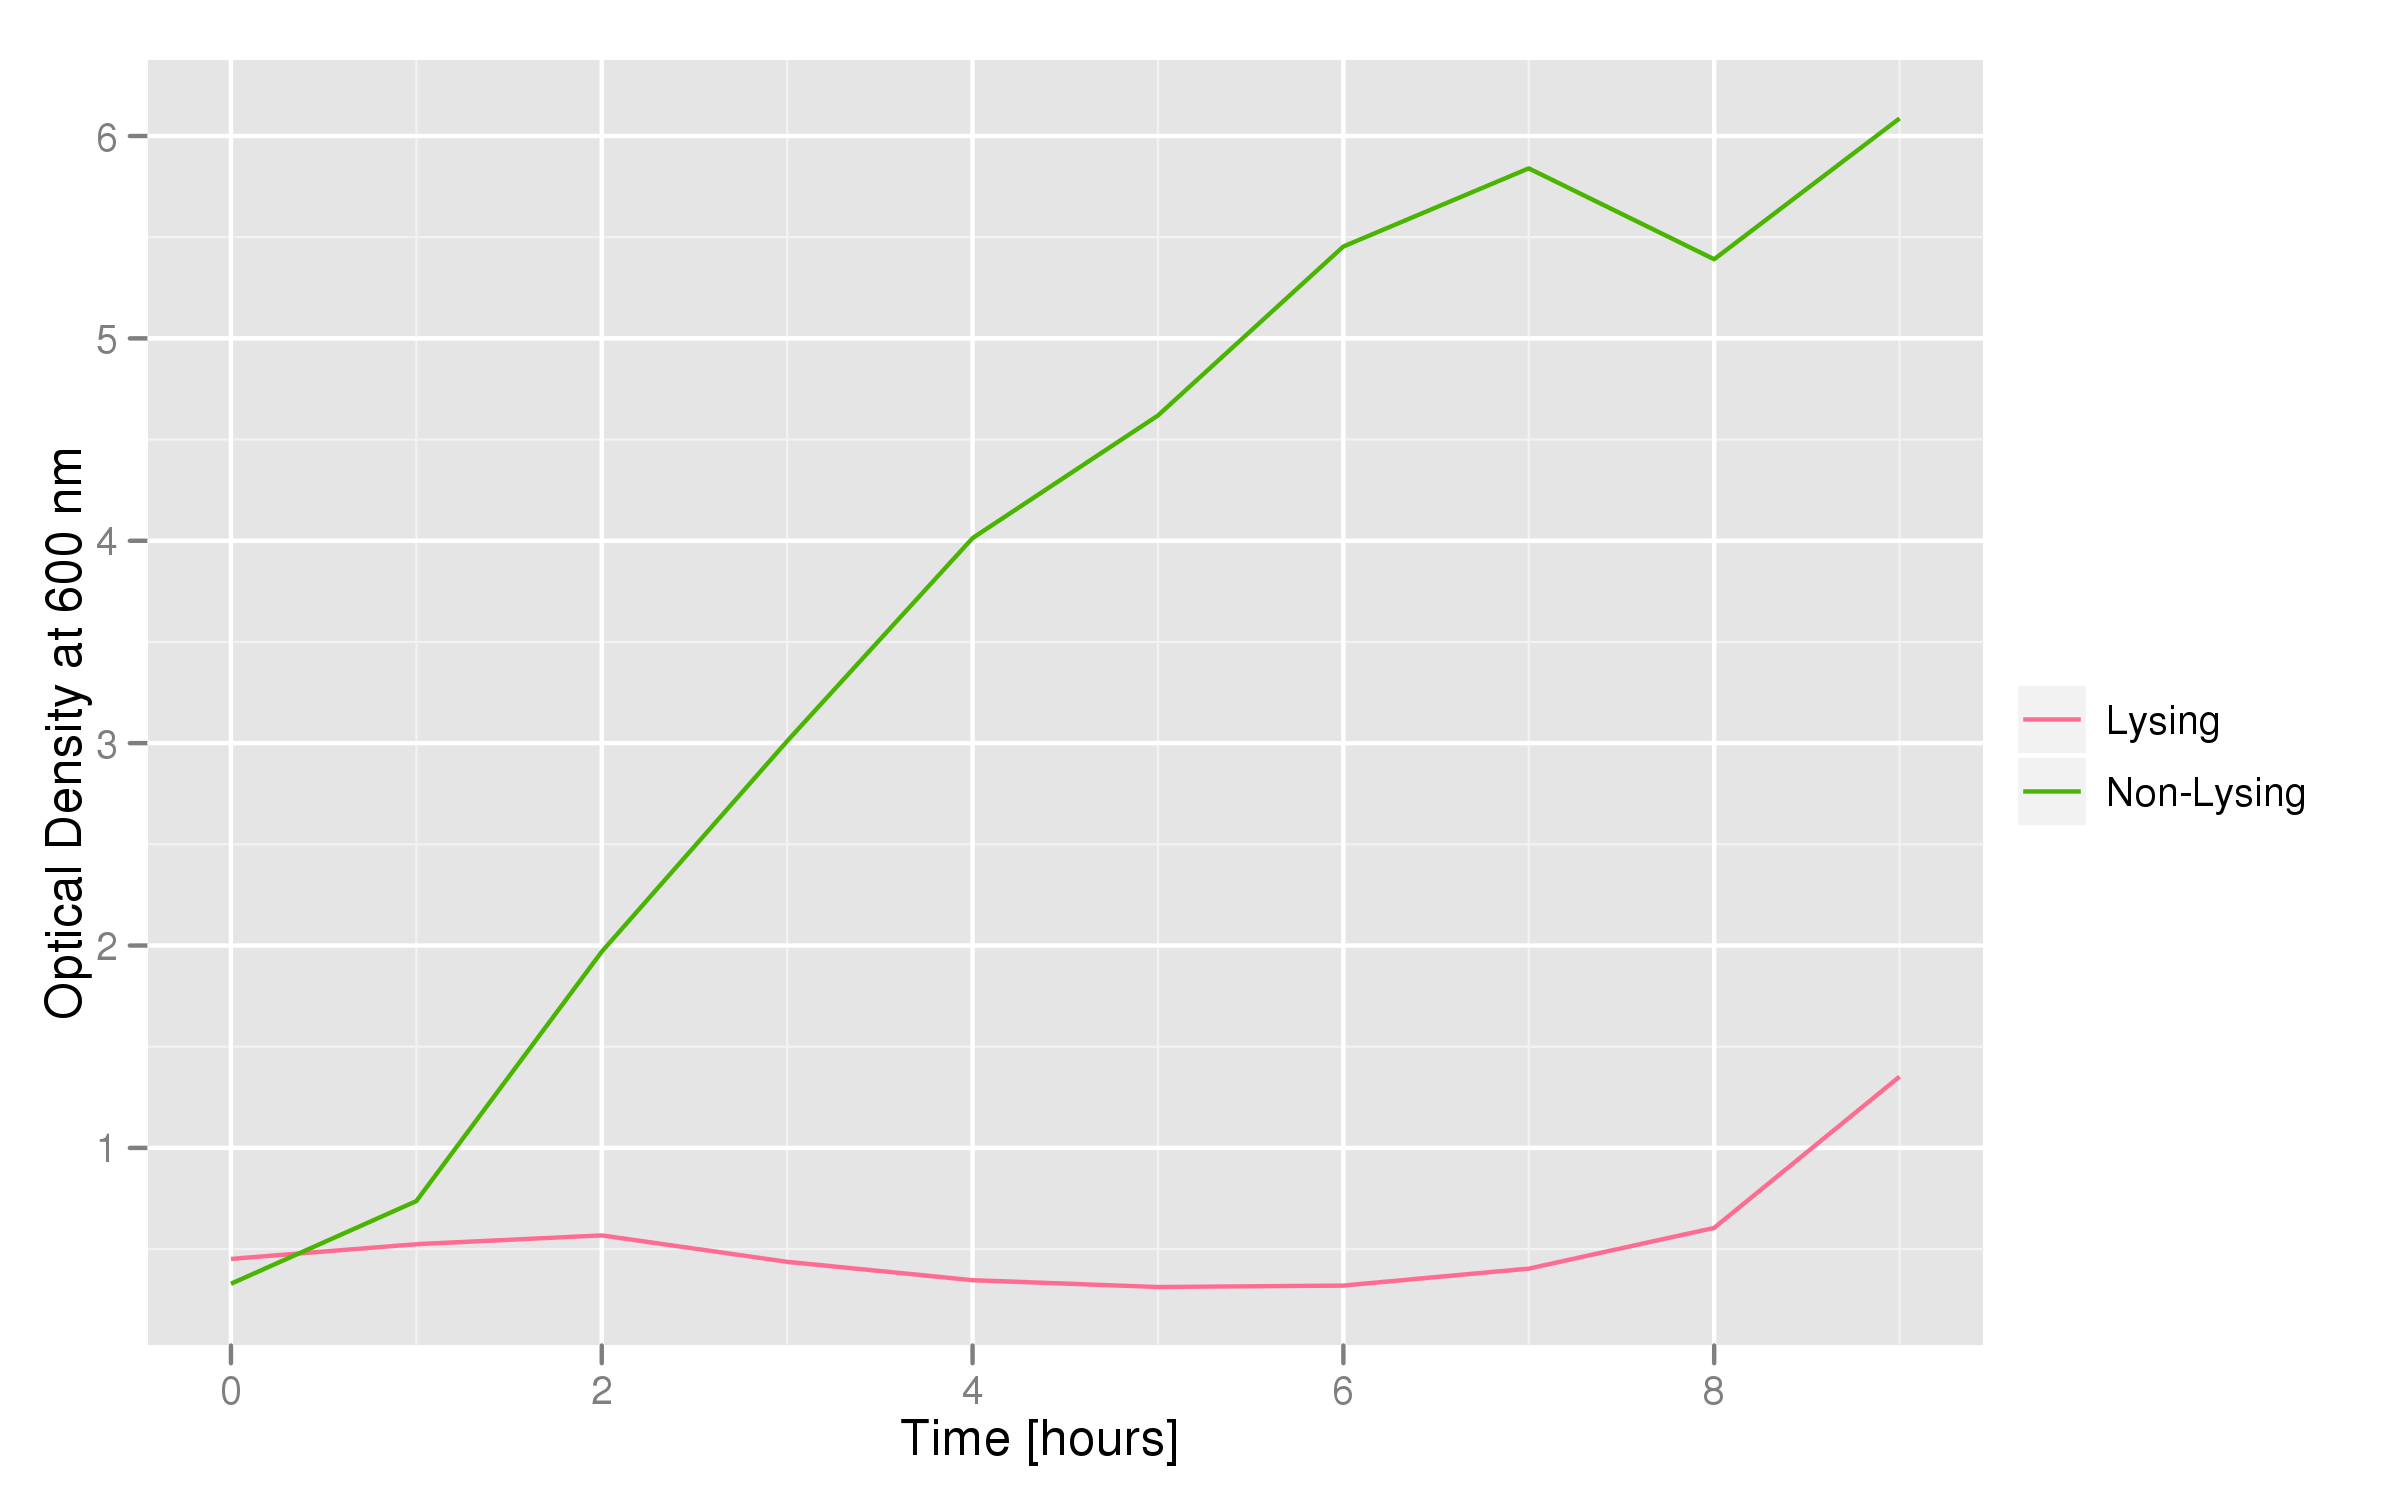
Optical density measurements were made every hour for 12 hours. The non-lysing cell culture grew as expected into a cloudy mix of cells, while the lysing cell culture showed ever-decreasing optical density. This graph confirms that lysis was indeed taking place.
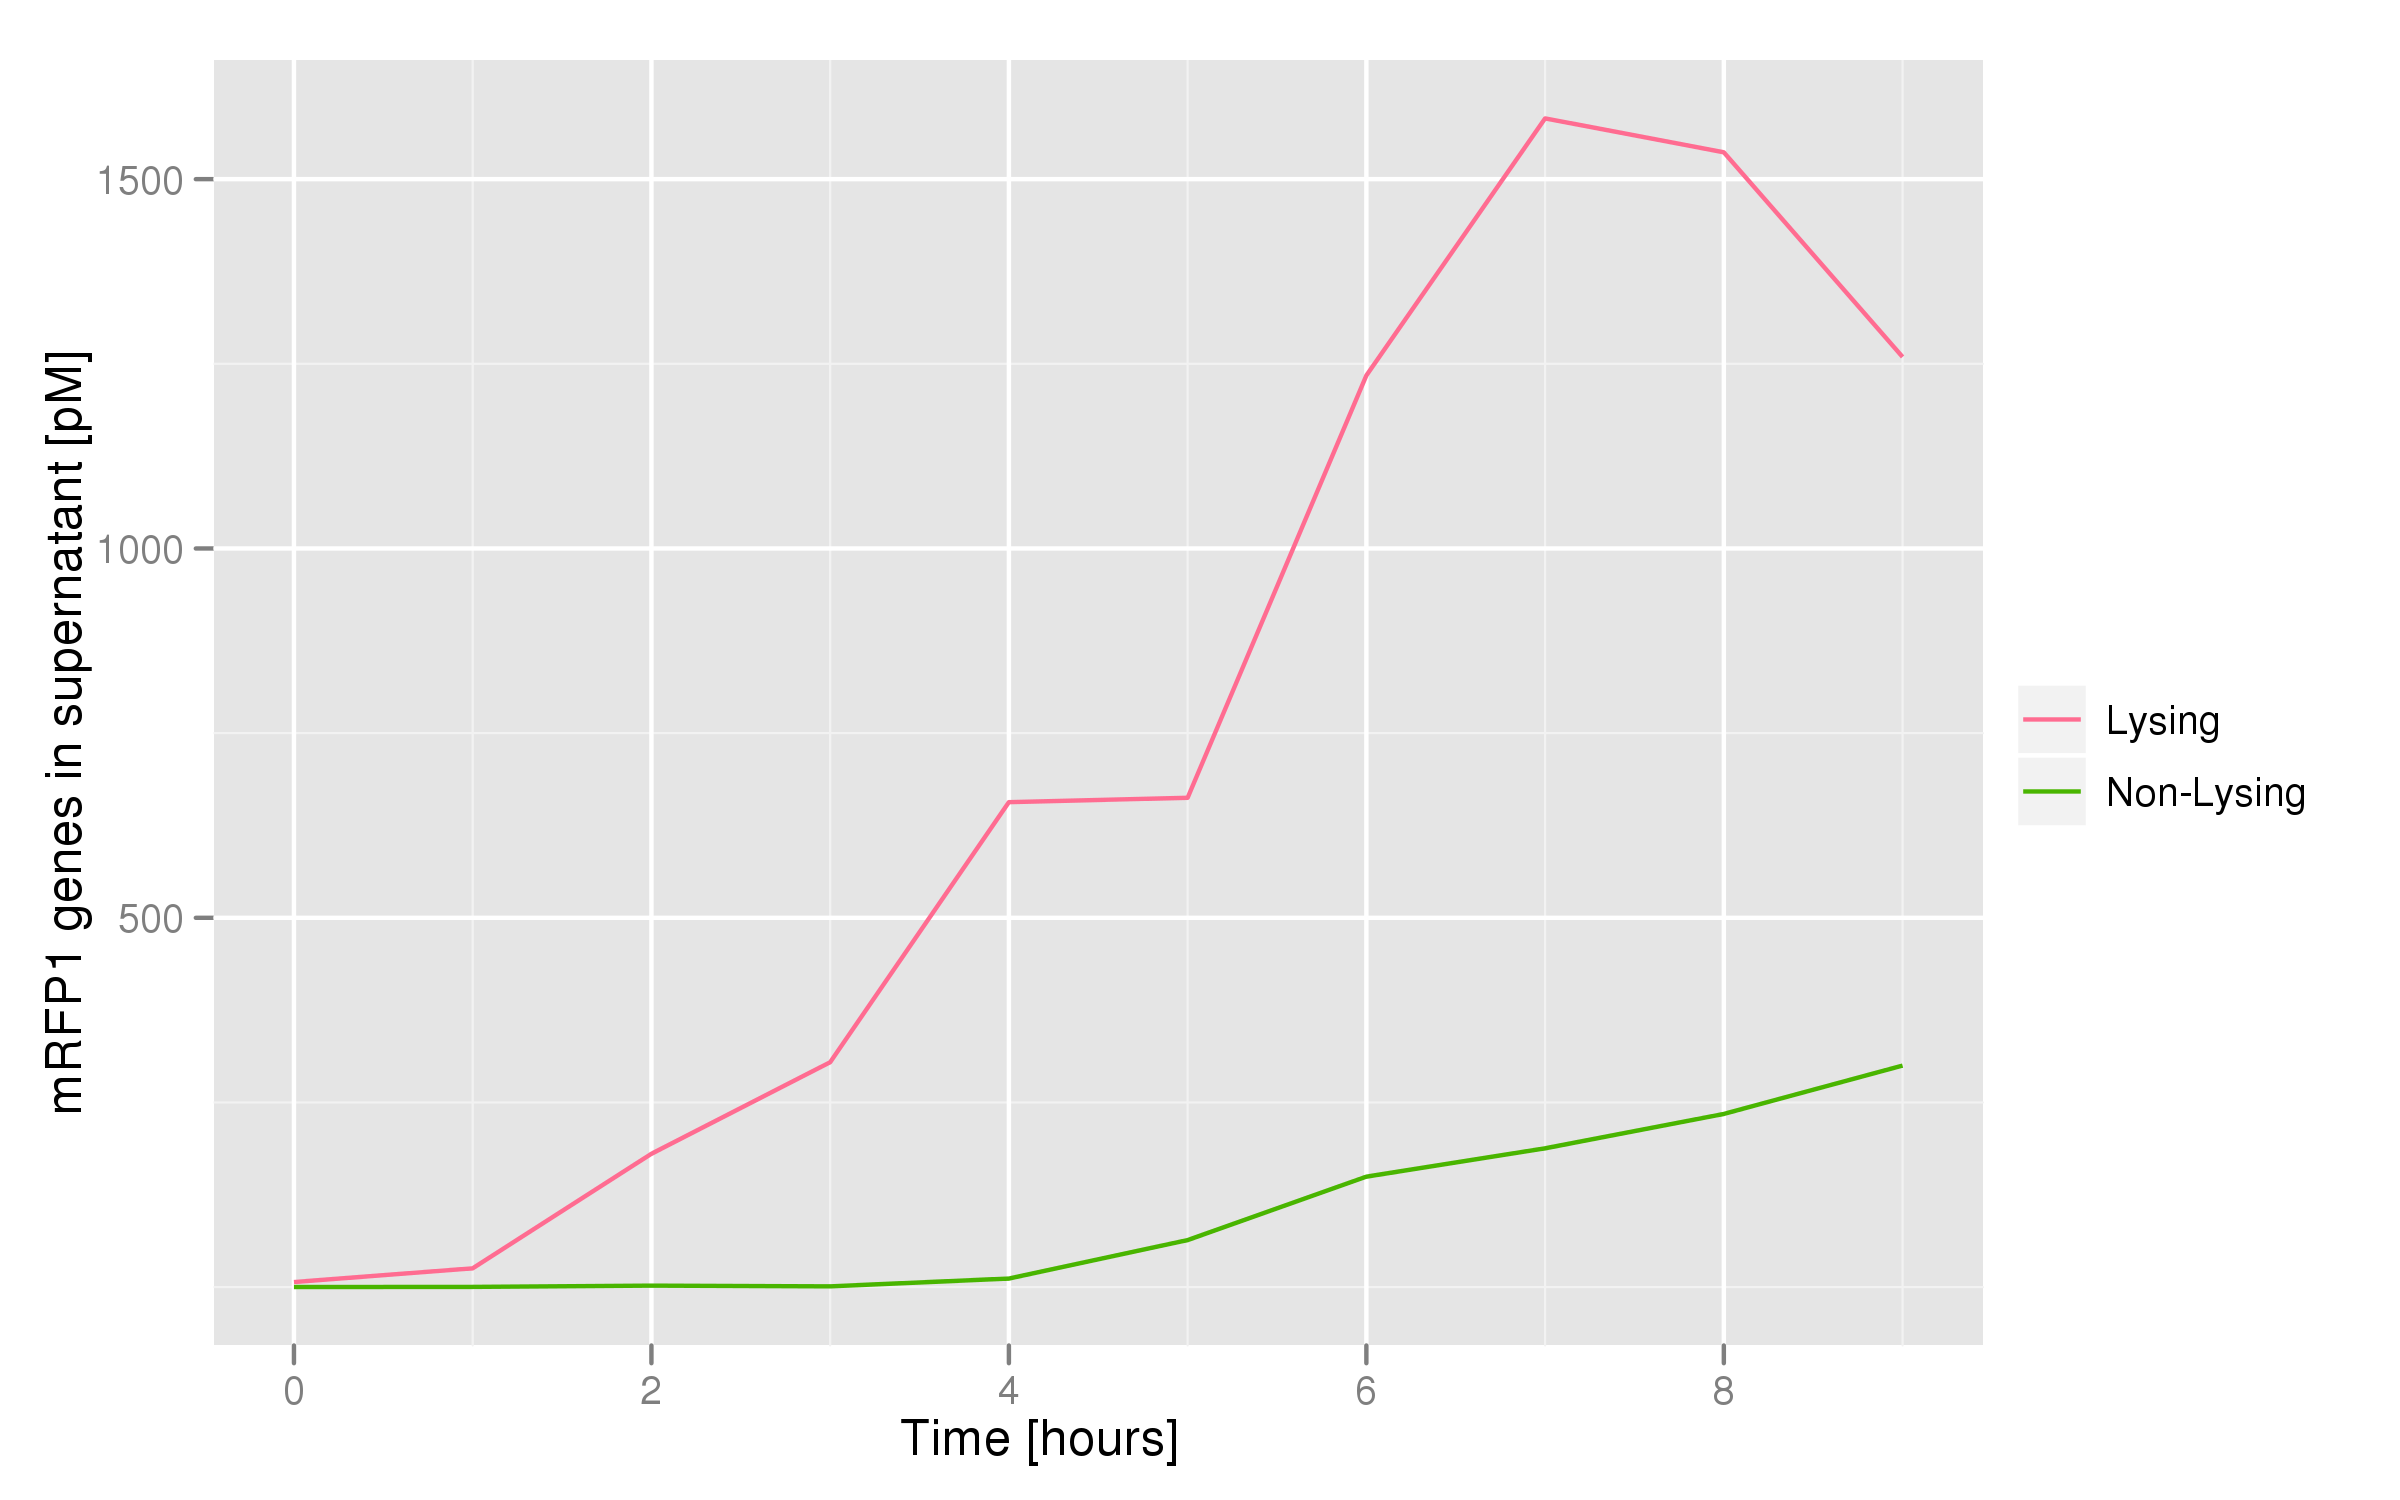
This chart shows the concentration of mRFP genes in the supernatant for each culture as the result of a qPCR. Both cultures contained cells with RFP plasmids. The lysing culture shows a definite increase in the number of mRFP plasmids in the supernatant over the course of the 10 hour experiment. The non-lysing culture shows a quasi-constant number of plasmids available in the supernatant. We can conclude that the DNA from the relevant lysed cells can be recovered from the supernatant.
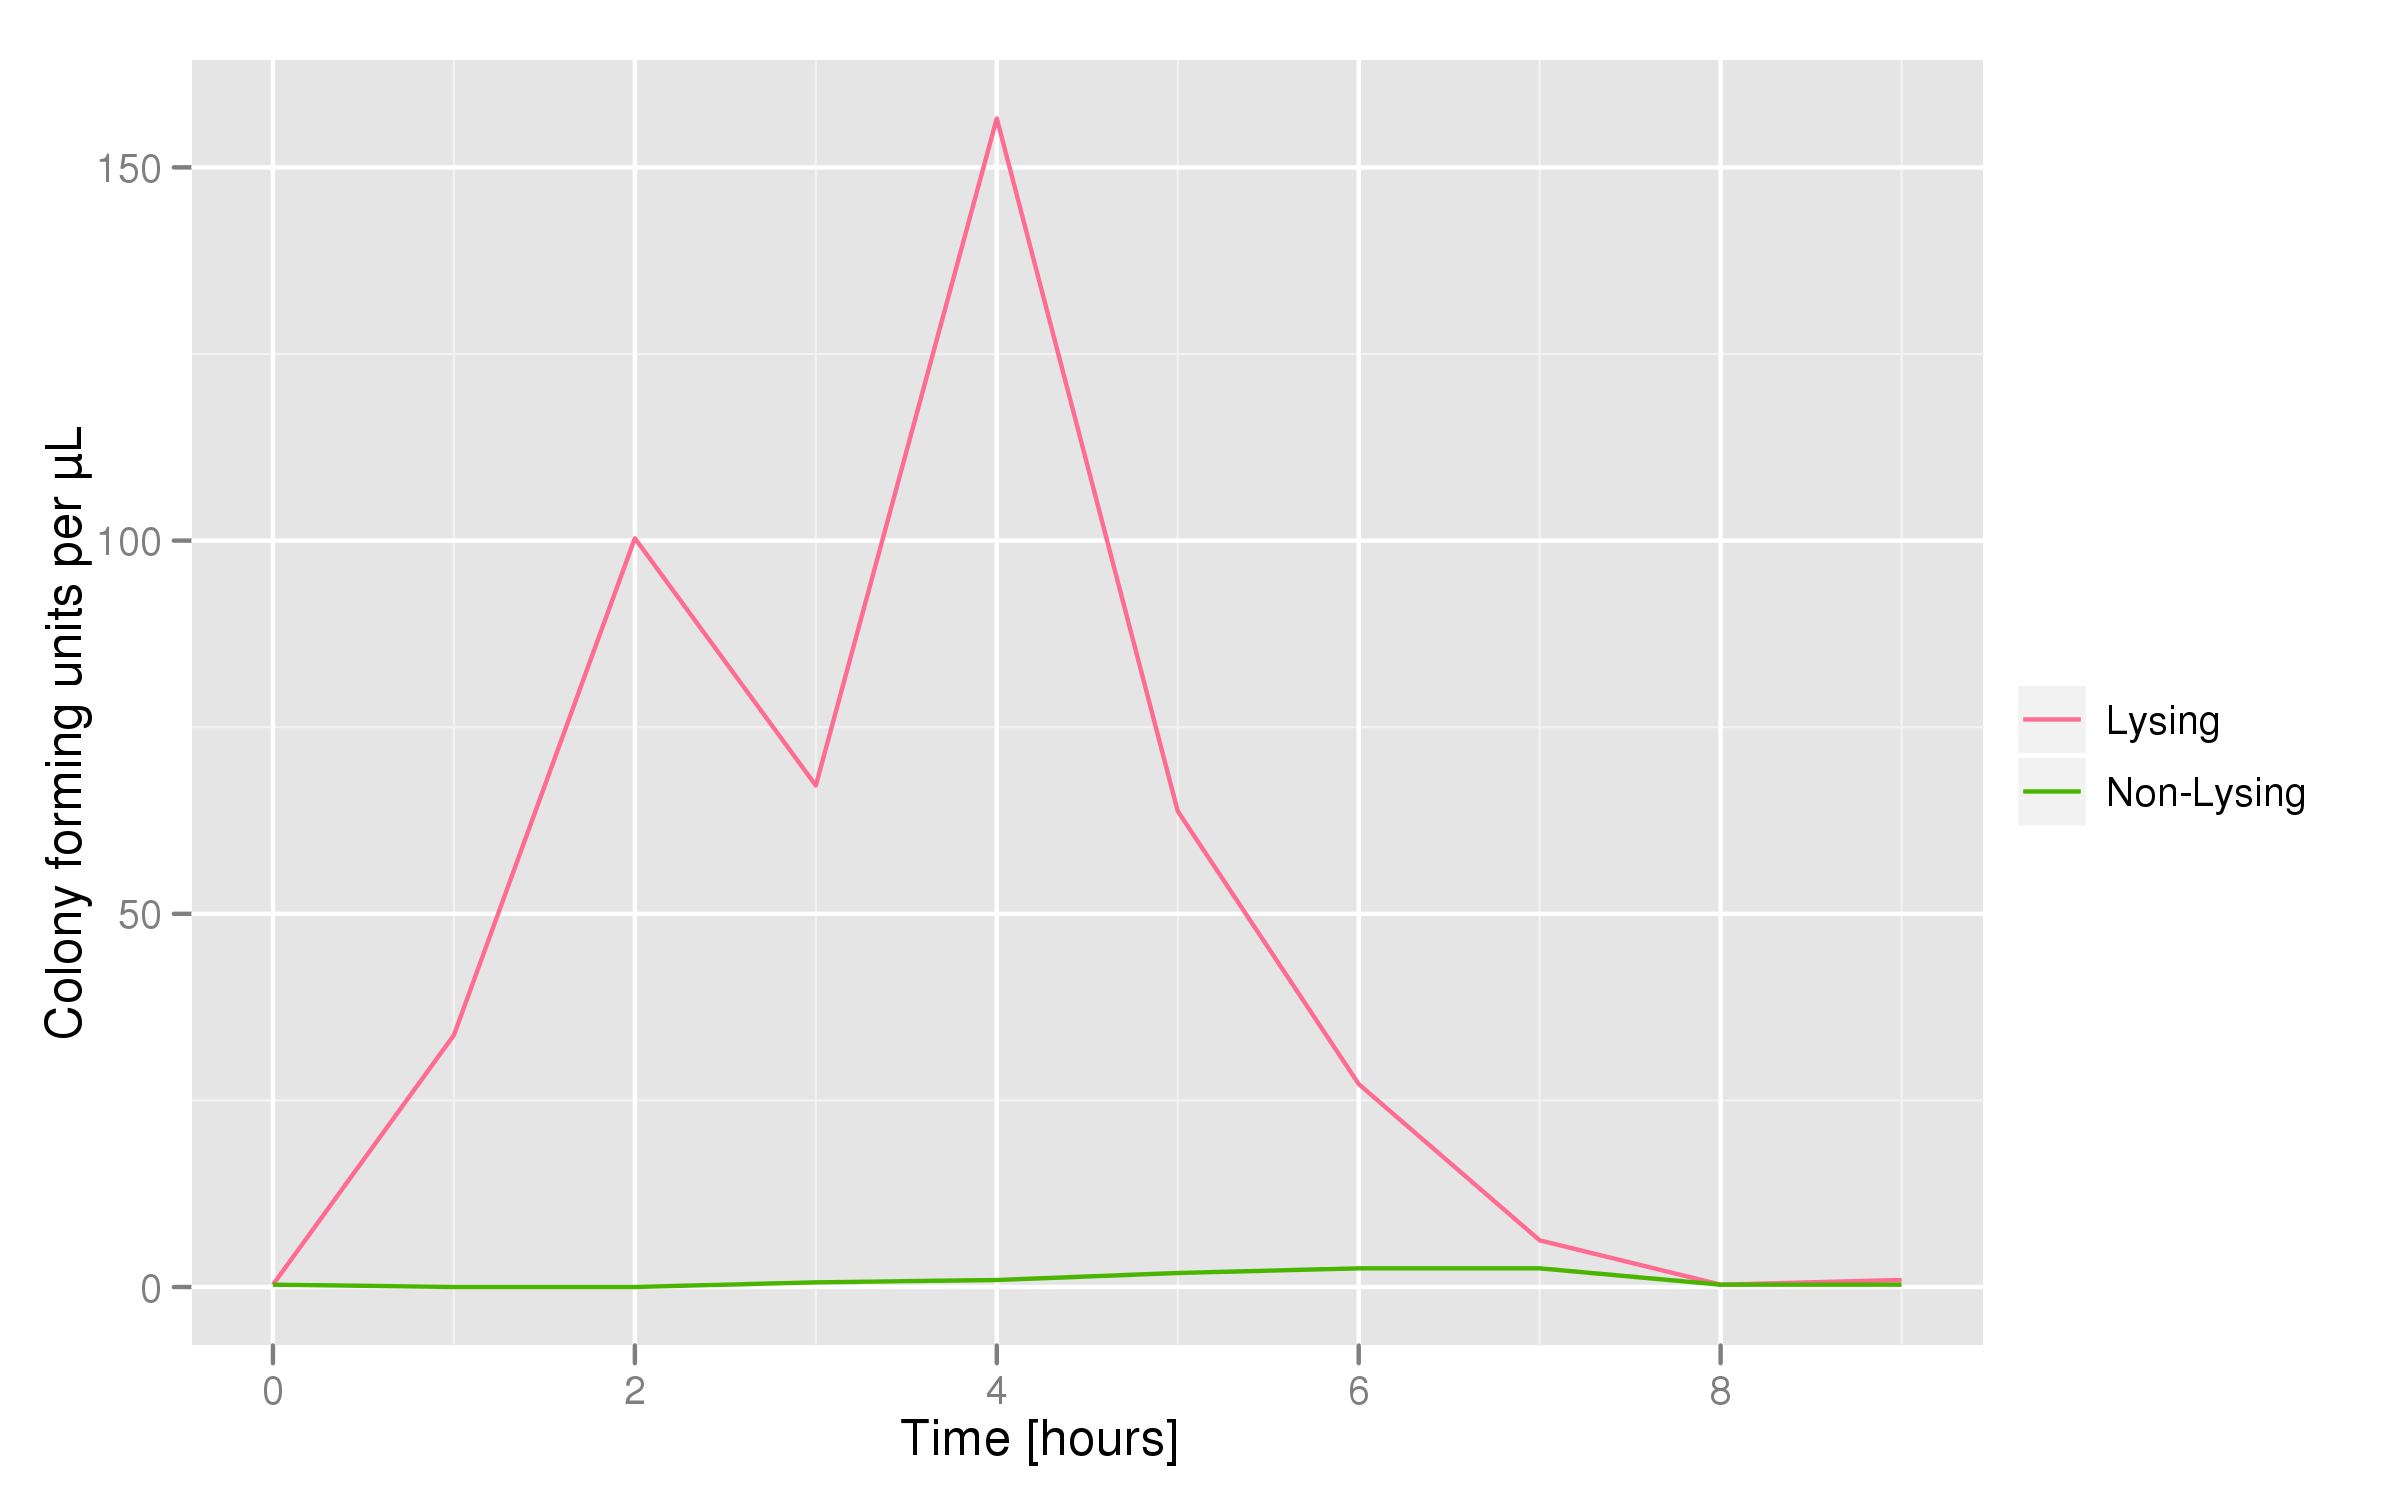
The colony fluorescence, the second method for quantifying the amount of recovered DNA, relates the number of colonies to the amount of transformant (in uL) that was plated. We find that the number of colonies taken from the lysing culture (all pink because of RFP) increases generally over time, while the number of colonies from the non-lysing culture is near-zero over the 10 hours of the experiment. The colony fluorescence count drops in the last three hours but this phenomenon can be explained by the fact that the contents of the cell (nucleases, etc...) damage the plasmids over time, leading to a lower transformation efficiency. In contrast, the qPCR data shows a monotonic increase in plasmid concentration without a drop over the last few hours. This result is an additional confirmation that DNA was recovered.
DNA Selection
Introduction
To round out the experiments for DNA recovery, it is essential that we show that the recovered DNA is in fact plasmid DNA from the relevant lysed cells. This is important because in our selection scheme we are only interested in the plasmids from cells expressing the lysis cassettes, and not the DNA from their neighbors (probably the majority of cells in a real selection).
Experimental Setup
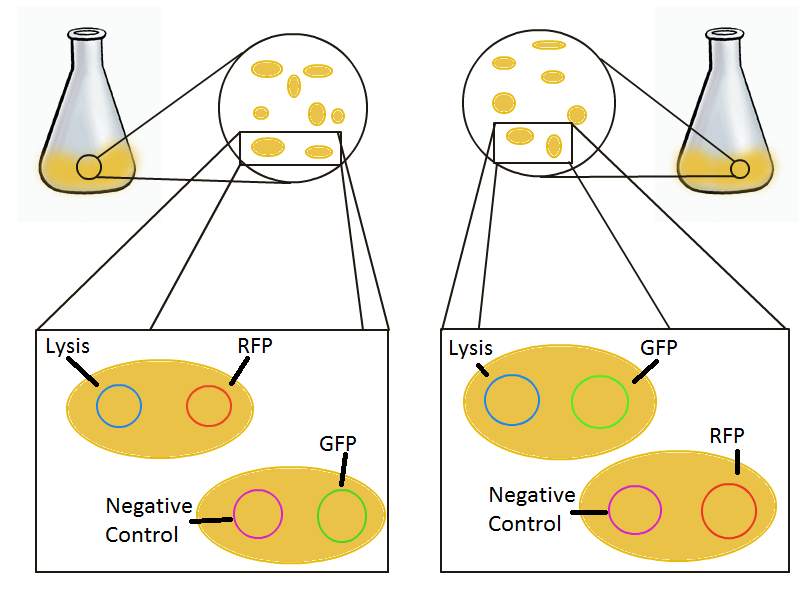
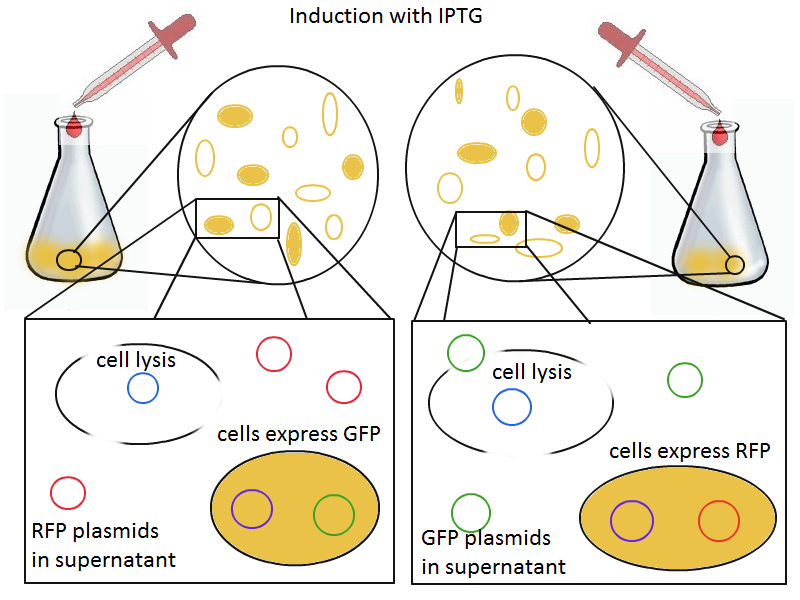
To that end, we again set up an experiment involving two flasks but this time each flask contains two types of cells. For one flask, one cell type is a co-transformation of a lysis plasmid (C2) and a RFP-containing plasmid and the other is a co-transformation of a negative control plasmid (C11) with a GFP-containing plasmid. In the other flask, the reverse is true: lysis (C2) is with GFP and negative control (C11) is with RFP. This co-culture experiment was prepared by mixing equal amounts of cells from an overnight culture in one big flask. After a 1h culture, we induced lysis with 500 µM IPTG. We measured optical density and took two supernatant samples every hour. One supernatant sample was centrifuged and sterile filtered to remove cell debris. It would be used for qPCR and transformation -- our two methods for quantifying the amount of recovered plasmid DNA. The other sample was used to keep track of fluorescence in the cells over the course of the experiment: the non-lysed cells were expected to fluoresce according to the appropriate gene (RFP or GFP, depending on the culture).
Results
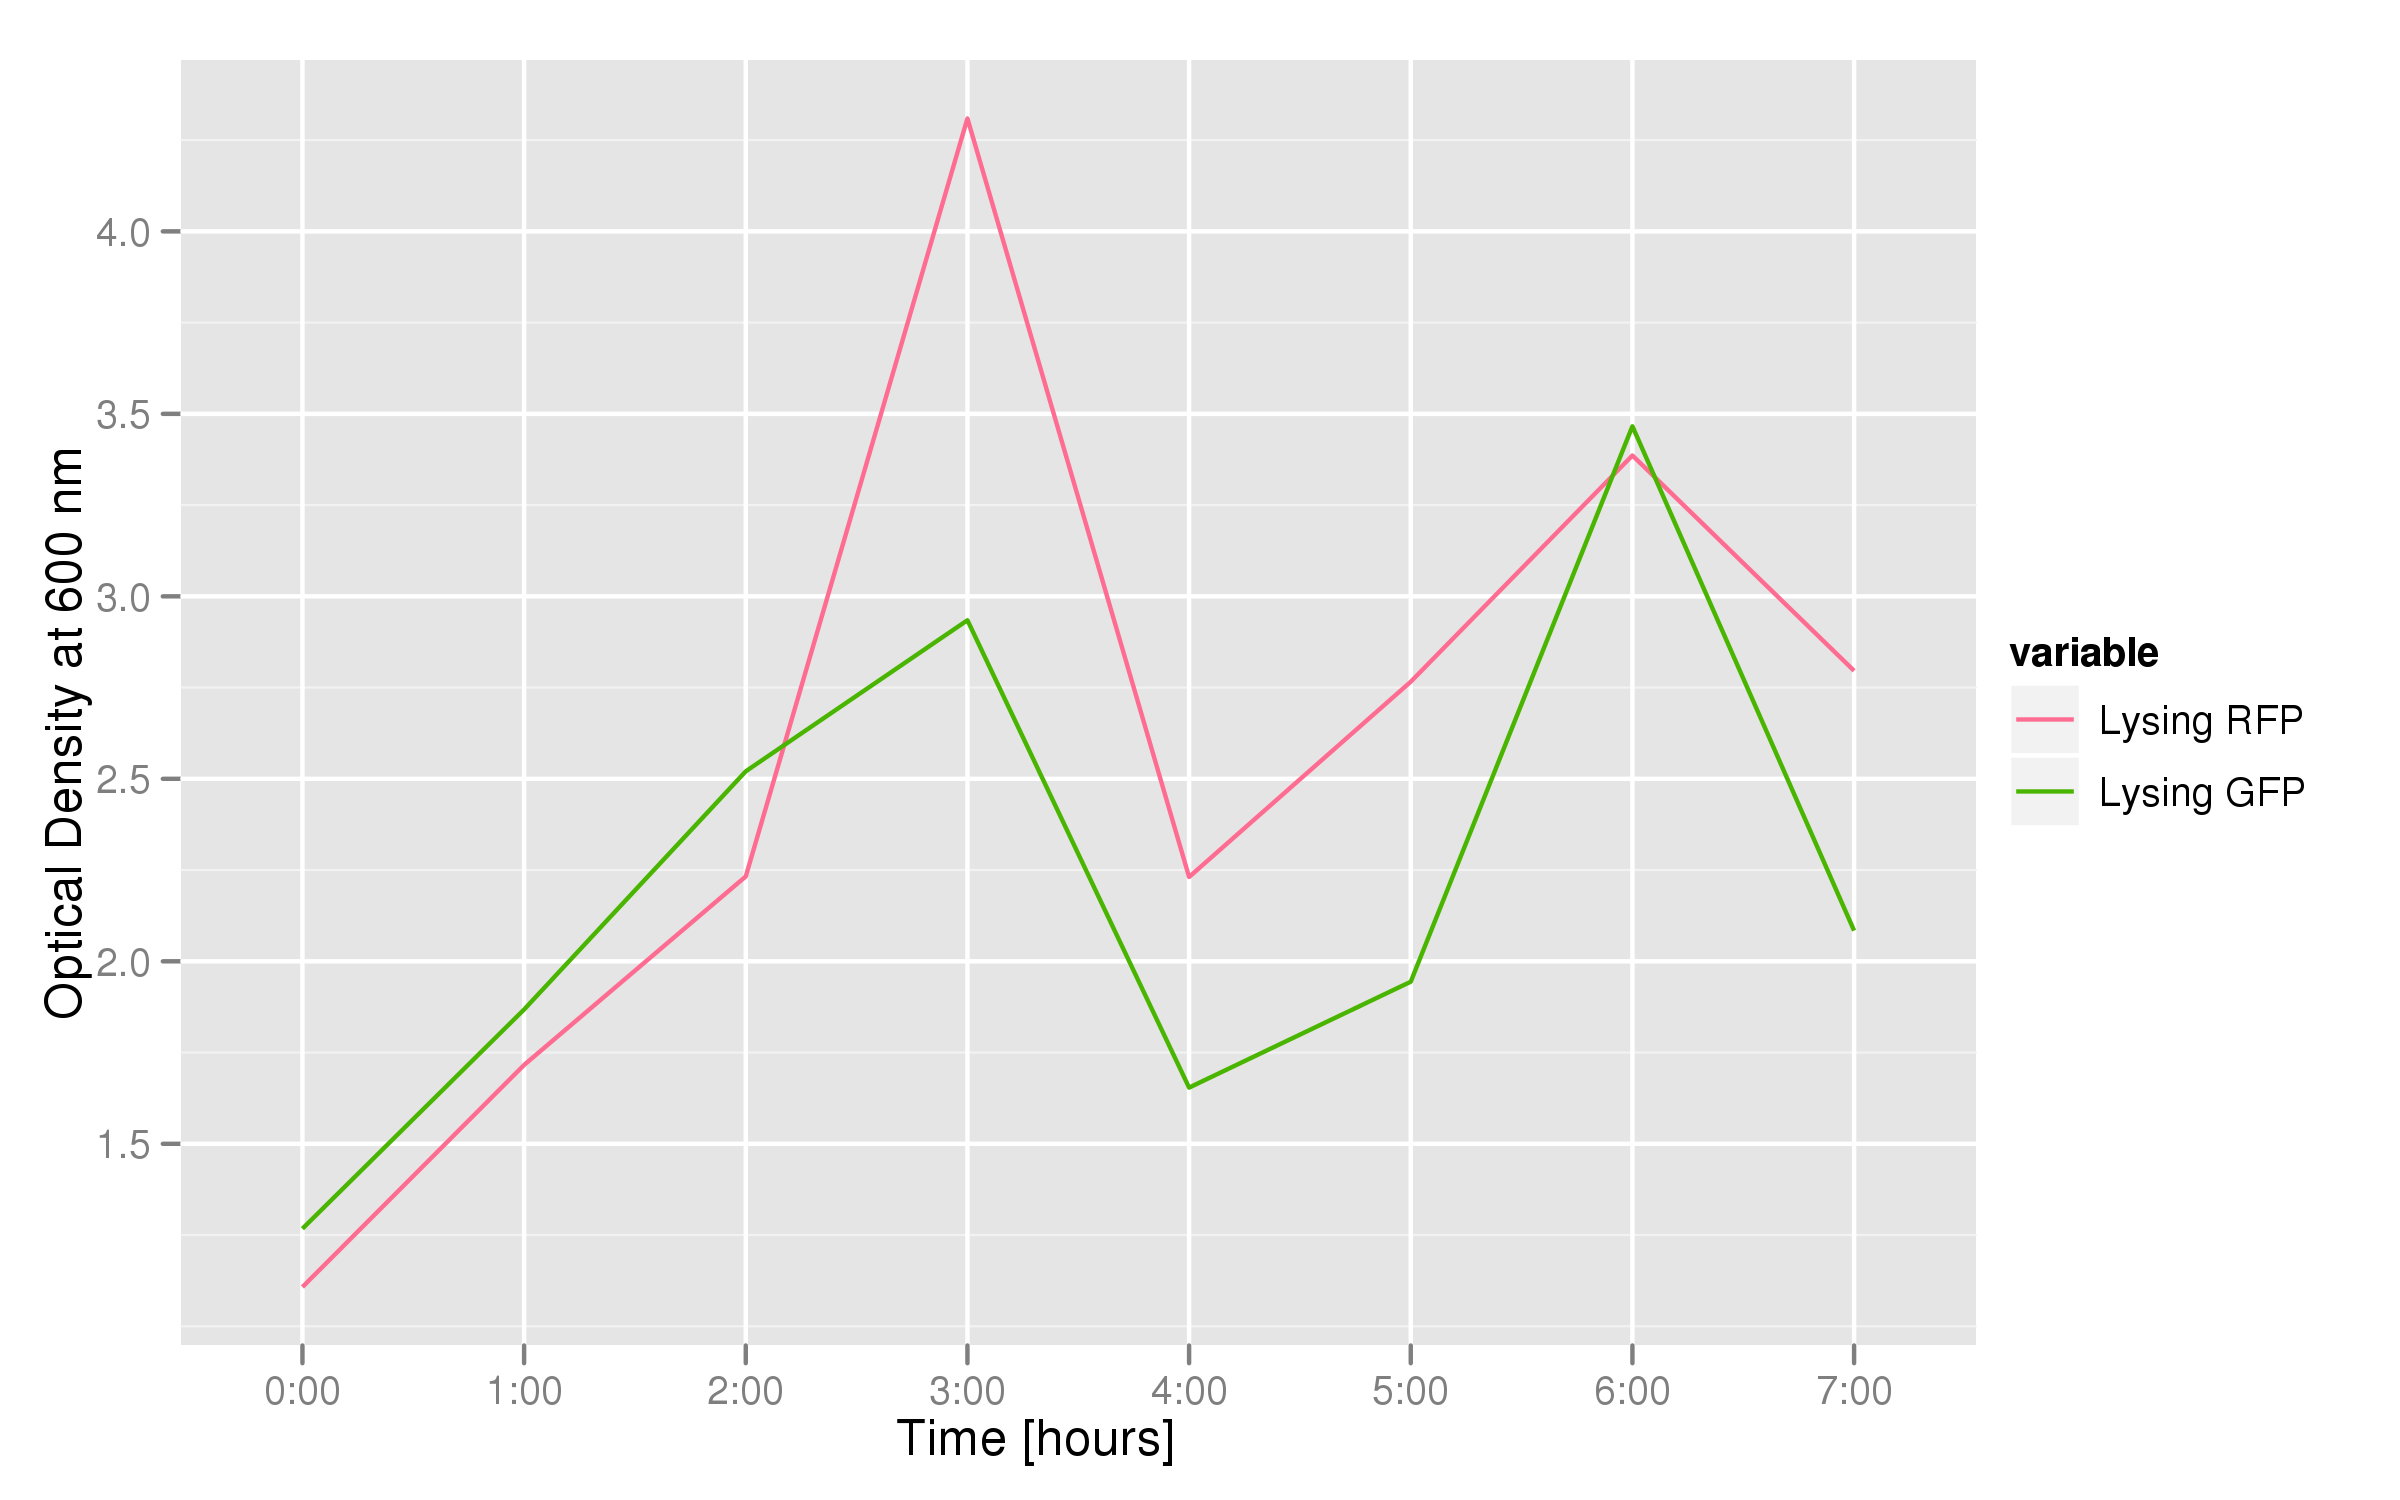
This graph tracks the optical density (measured at 600 nm) over time of the two flasks. It can only be used to confirm that there was growth in each flask, which is to be expected since each flask contains both lysing and non-lysing cells. The growth dynamics are a bit strange, but the optical density increases generally over time.
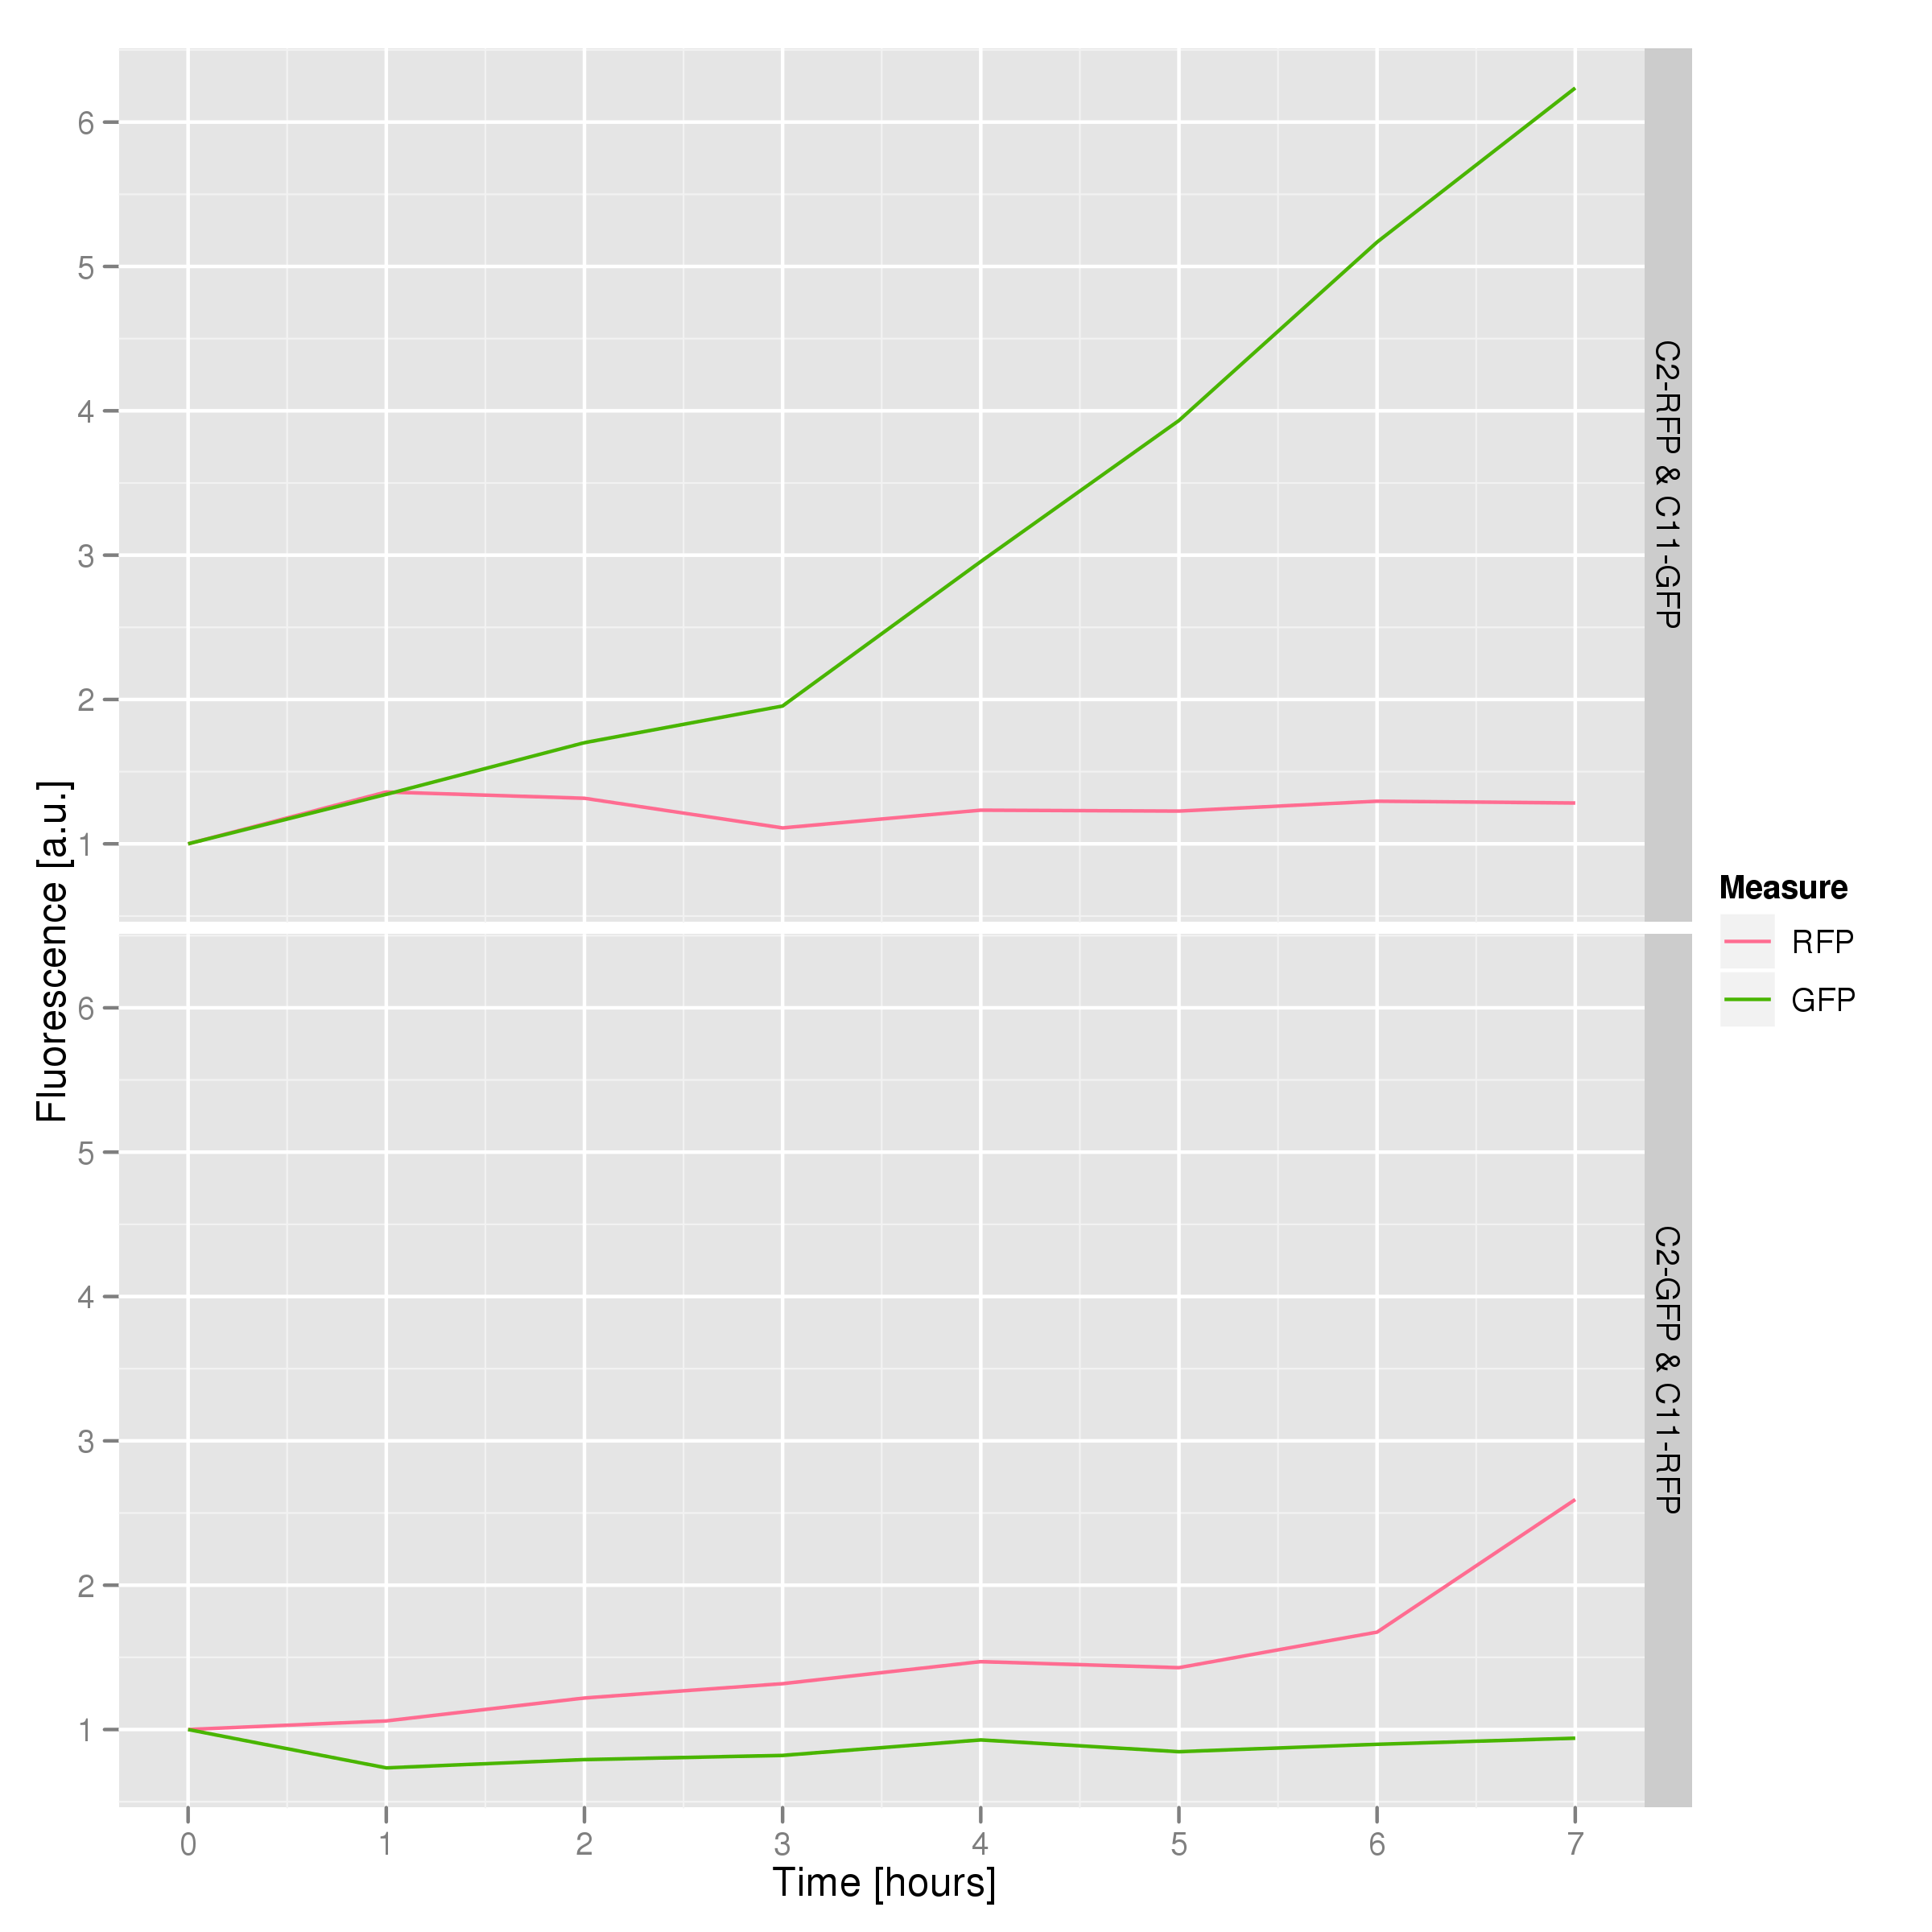
The fluorescence data shows that, in both cases, the non-lysing cells kept producing fluorescent protein, meaning that there was no general, unselective lysis going on. The relevant fluorescence grew over time, as expected for non-lysing cells. The negative-control culture containing RFP seems to have grown less radically than its GFP counterpart, but the difference with respect to the lysis culture is substantial (see the lower of the two graphs).
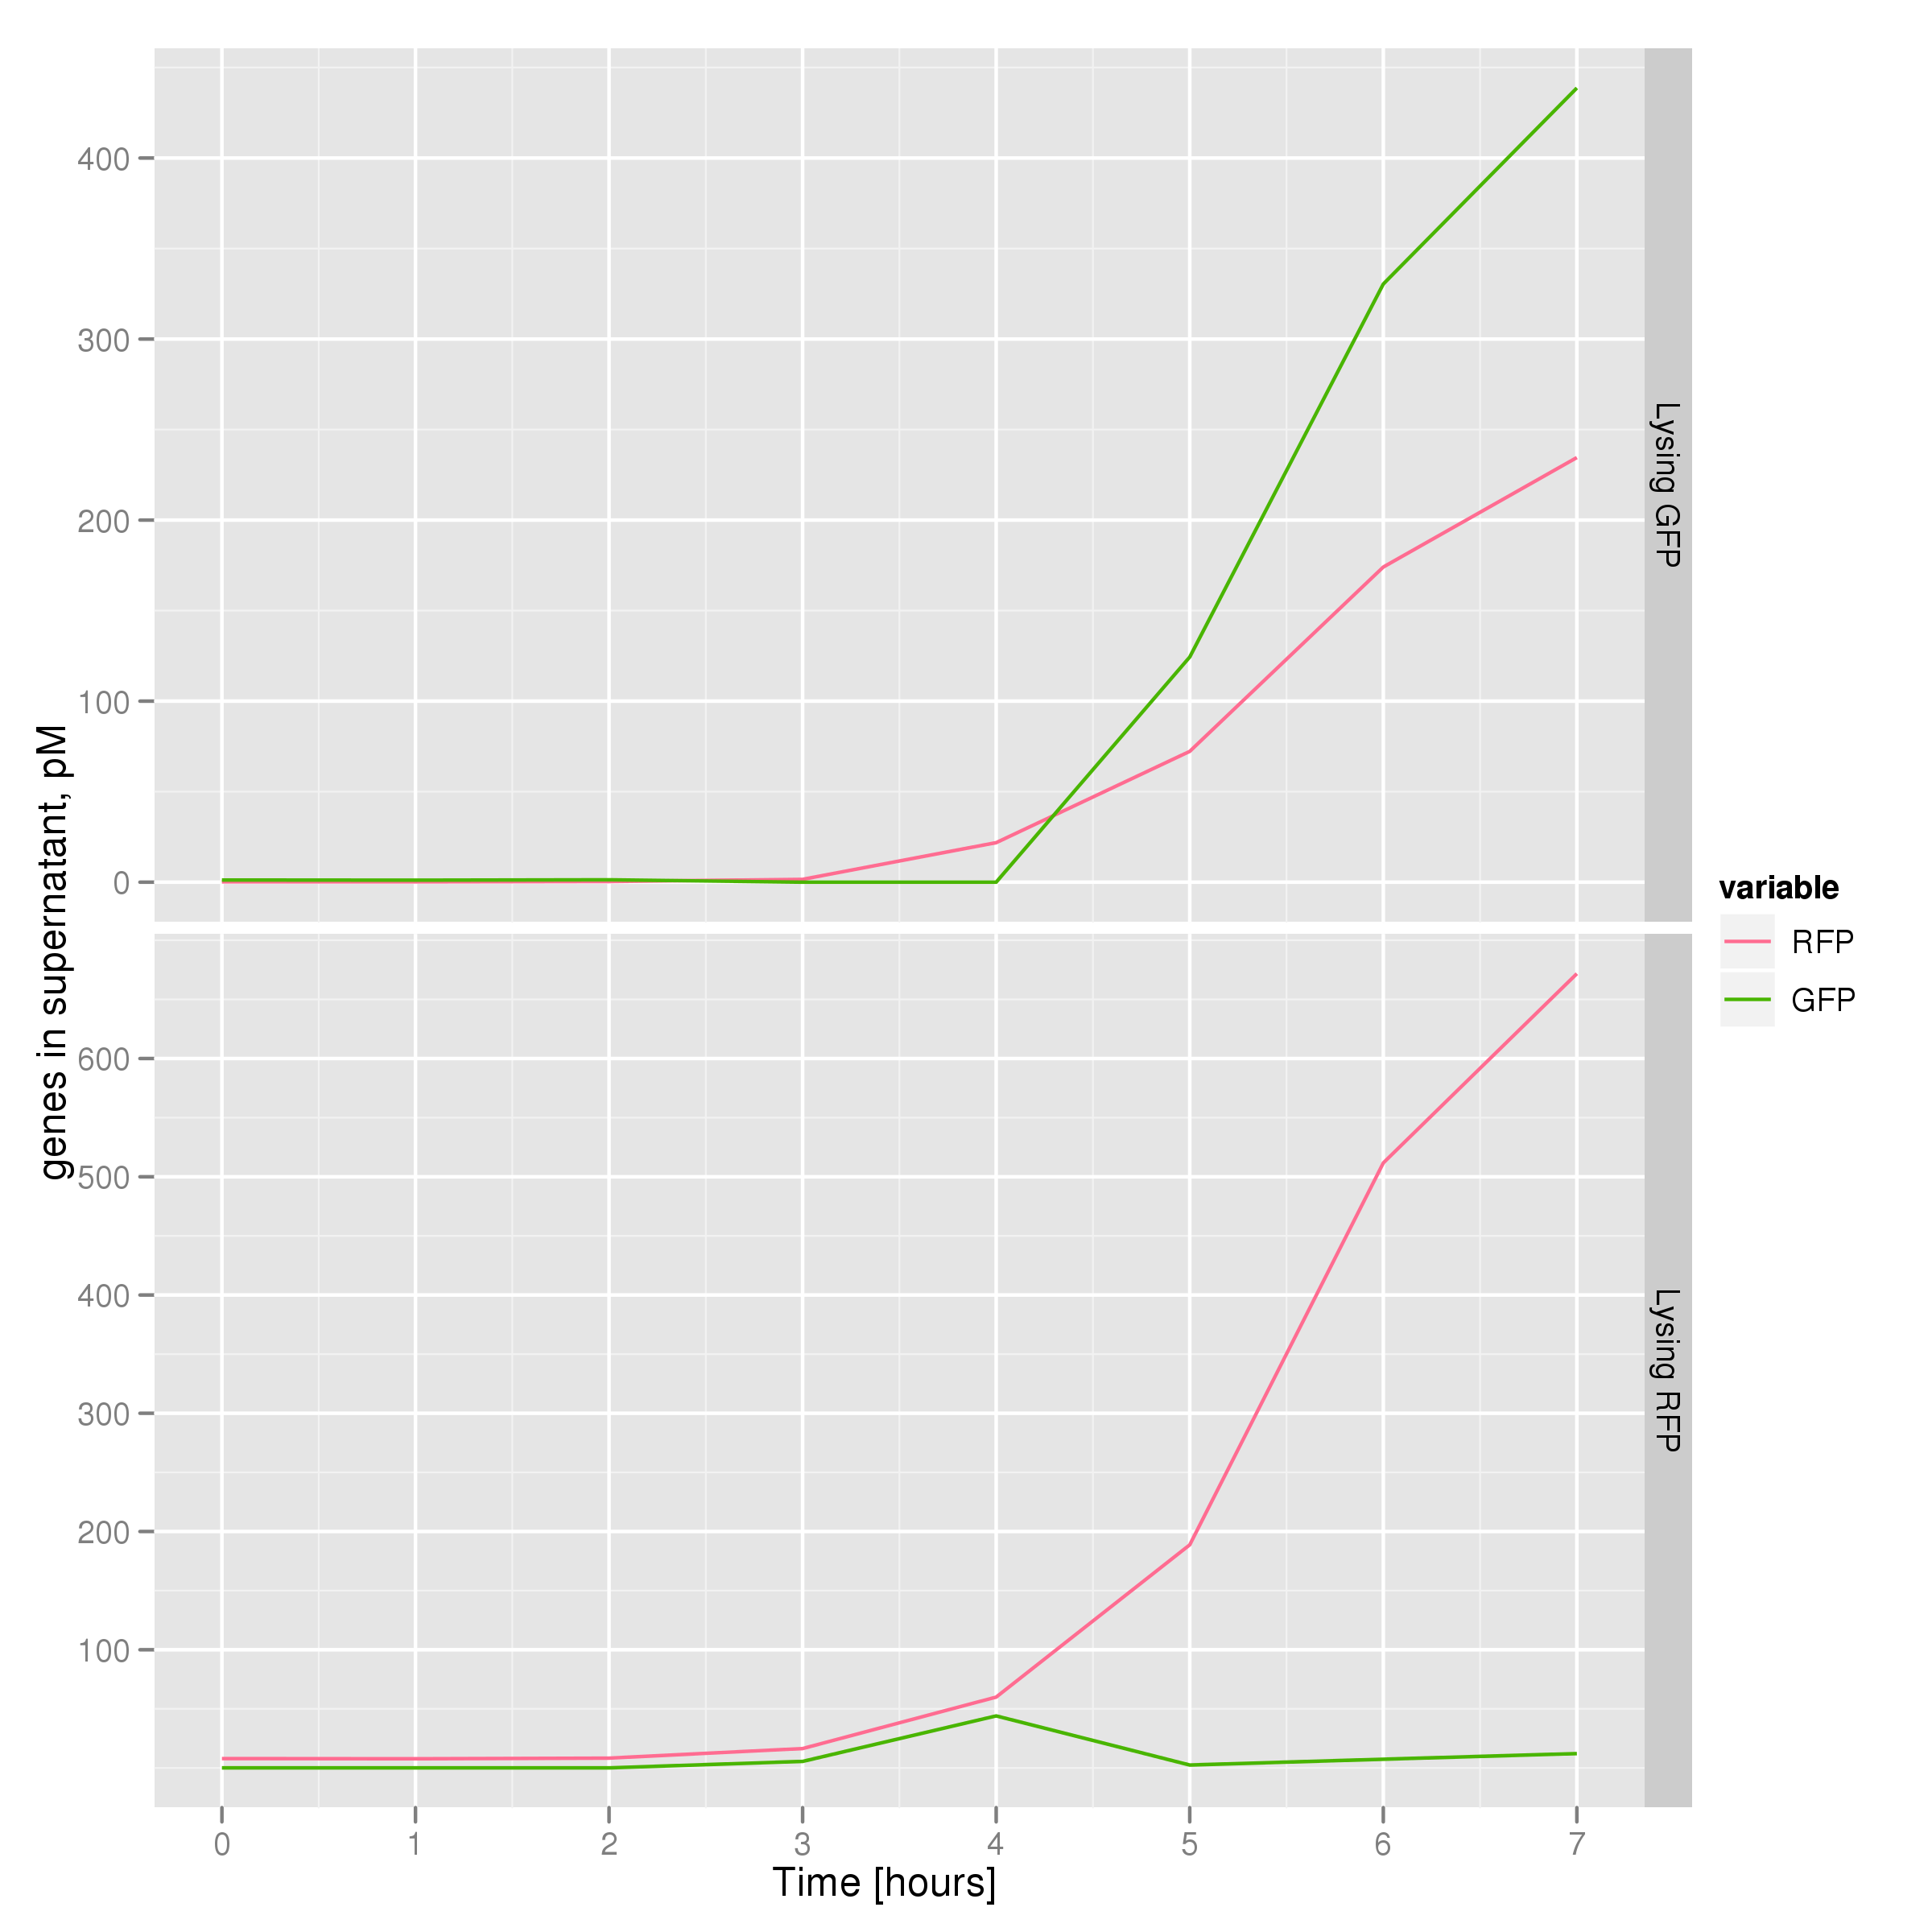
The qPCR data in this graph indicates that the content of the supernatant is indeed the expected content, with respect to the twin cultures of each flask. Where lysed cells are expected to release GFP plasmids, we find GFP genes in the supernatant in much higher concentrations than RFP and vice-versa in the other flask. We can thereby confirm that the right DNA is selected in each flask and finds its way into the supernatant.
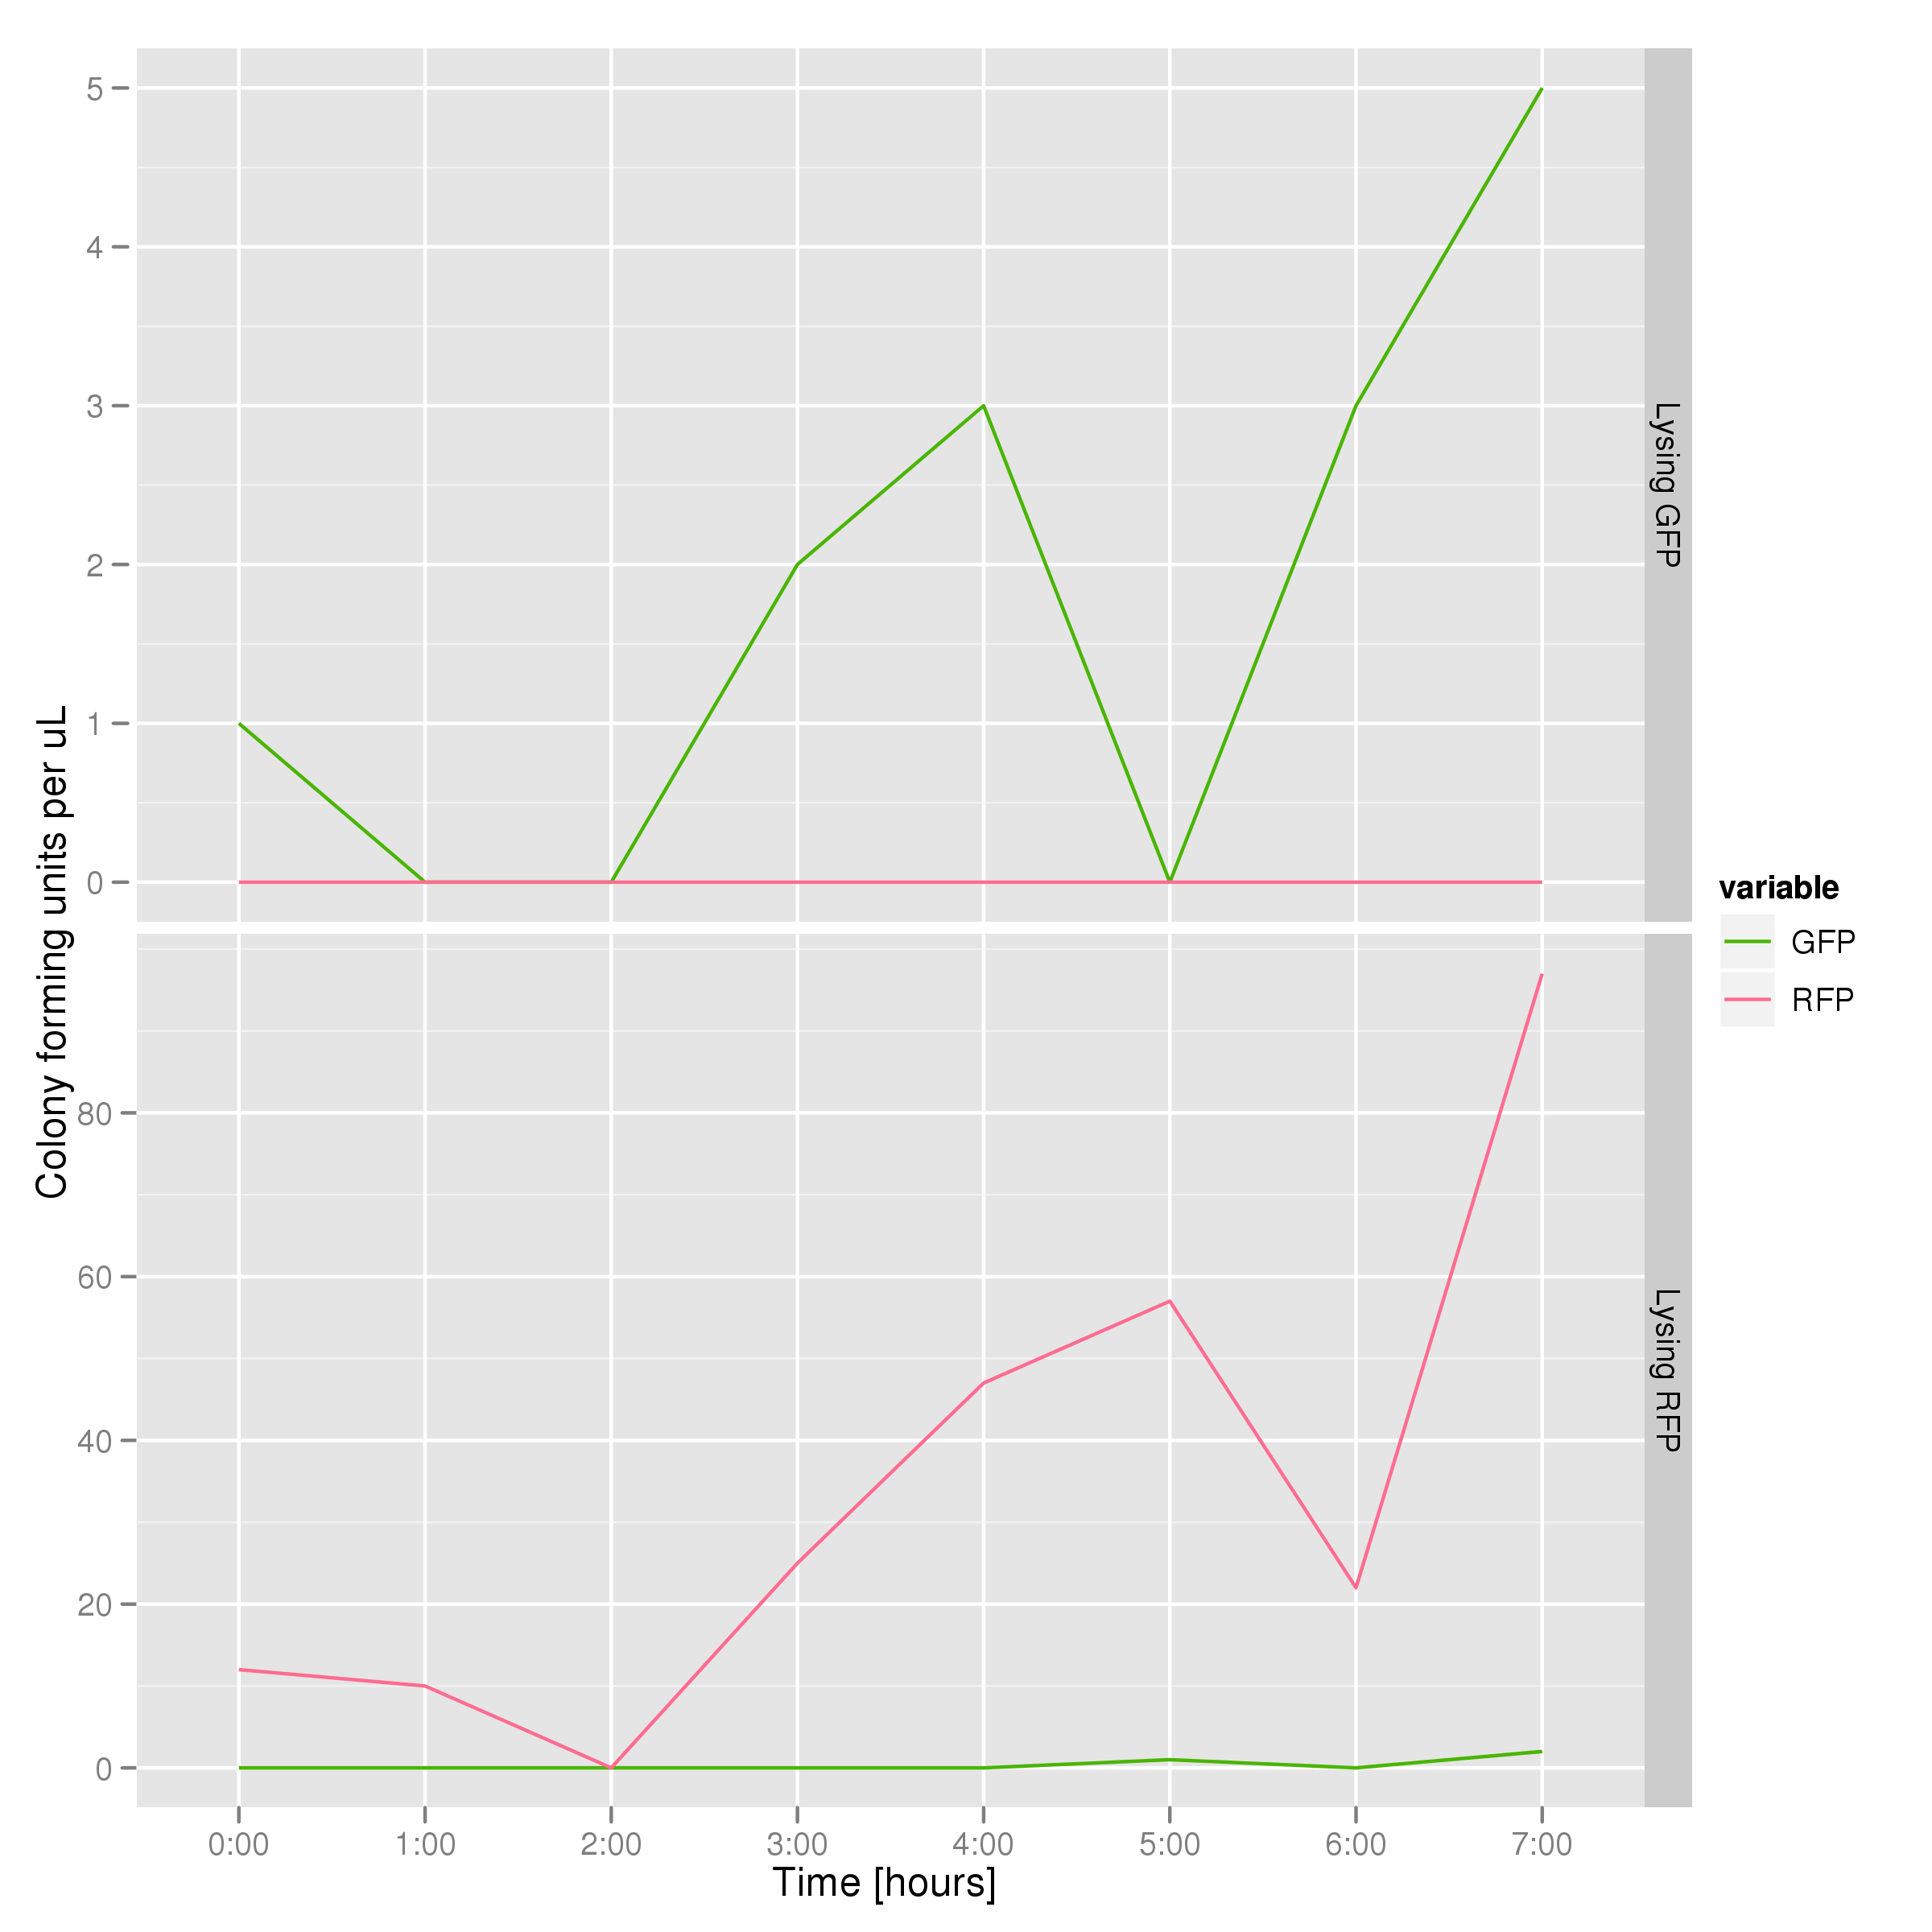
The colony fluorescence count, which is our other method for quantifying DNA concentration in the supernatant, also confirms the qPCR data from the previous graph. Indeed, the ratio of RFP colonies to GFP colonies per plate in the case of cells that lyse and release RFP plasmids grows over the course of the experiment. In practical terms, the likelihood of recovering DNA that is not the desired DNA (i.e. natural cell death leading to plasmids in the supernatant) is low.
BBa_K112808 - Enterobacteria phage T4 Lysis Device - UNIPV-Pavia Team (test performed by L. Pasotti, M. Lupotto, S. Zucca, R. De Molfetta)
Description
The UNIPV-Pavia Team decided to build up a specific measurement system: BBa_K173015, in which we can modulate the expression of the lysis genes through BBa_F2620 inducible device. During this summer we have also characterized BBa_F2620 in standard units, so the characterization of the lysis device is promoter-independent.
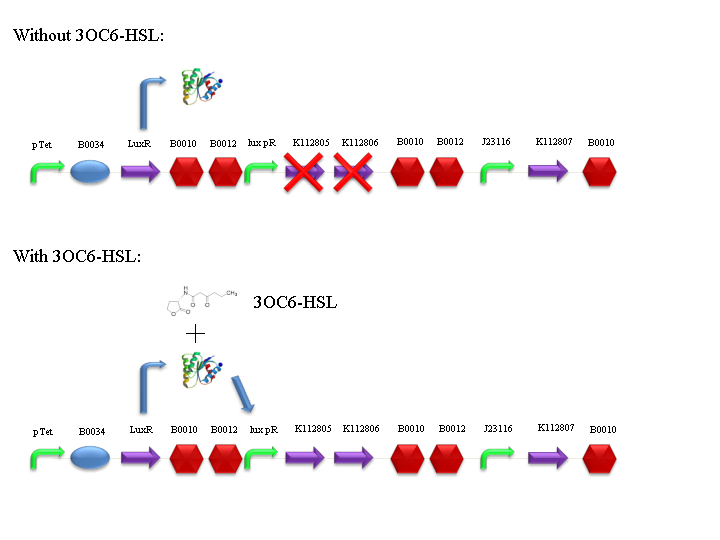
BBa_F2620 receiver device controls the expression of holin (BBa_K112805) and lysozyme (BBa_K112806) genes from T4 bacteriophage. Holins form pores in the inner membrane of bacteria, while lysozymes degrade the peptidoglycan layer, passing through these pores and performing the lysis of the bacterial cell. This device also contains a constitutive expression of an antiholin (BBa_K112807), which inhibits holin multimer formation.
Lysis can be induced with 3OC6-HSL autoinducer molecule: it binds luxR protein (encoded by BBa_C0062), which is constitutively expressed by tetR promoter (BBa_R0040). LuxR-HSL complex can work as a transcriptional activator for lux promoter (BBa_R0062).
Characterization
Compatibility: E. coli TOP10 in pSB1A2.
We performed four experiments on our measurement system (BBa_K173015) in order to characterize BBa_K112808 activity.
All the experiments have been performed in the same conditions in the microplate reader and involved the induction of BBa_K173015 with 3OC6-HSL 10 nM (which corresponds to a RPU value of 4.44 [3.81 ; 5.44] in LB for BBa_F2620) and 100 nM (which corresponds to a RPU value of 4.53 [3.88 ; 5.18] in LB for BBa_F2620). The basic activity of BBa_F2620 was ~0 RPU.
O.D.600 has been used to measure the amount of bacteria in the wells.
Experiment 1 results
We tested BBa_K173015 and BBa_K173010 as a negative control. These two parts were tested according to Microplate reader experiments section, except for BBa_K173015 first inoculum, which was performed from single colonies in a streaked LB agar plate. Three colonies were tested separately for this part.
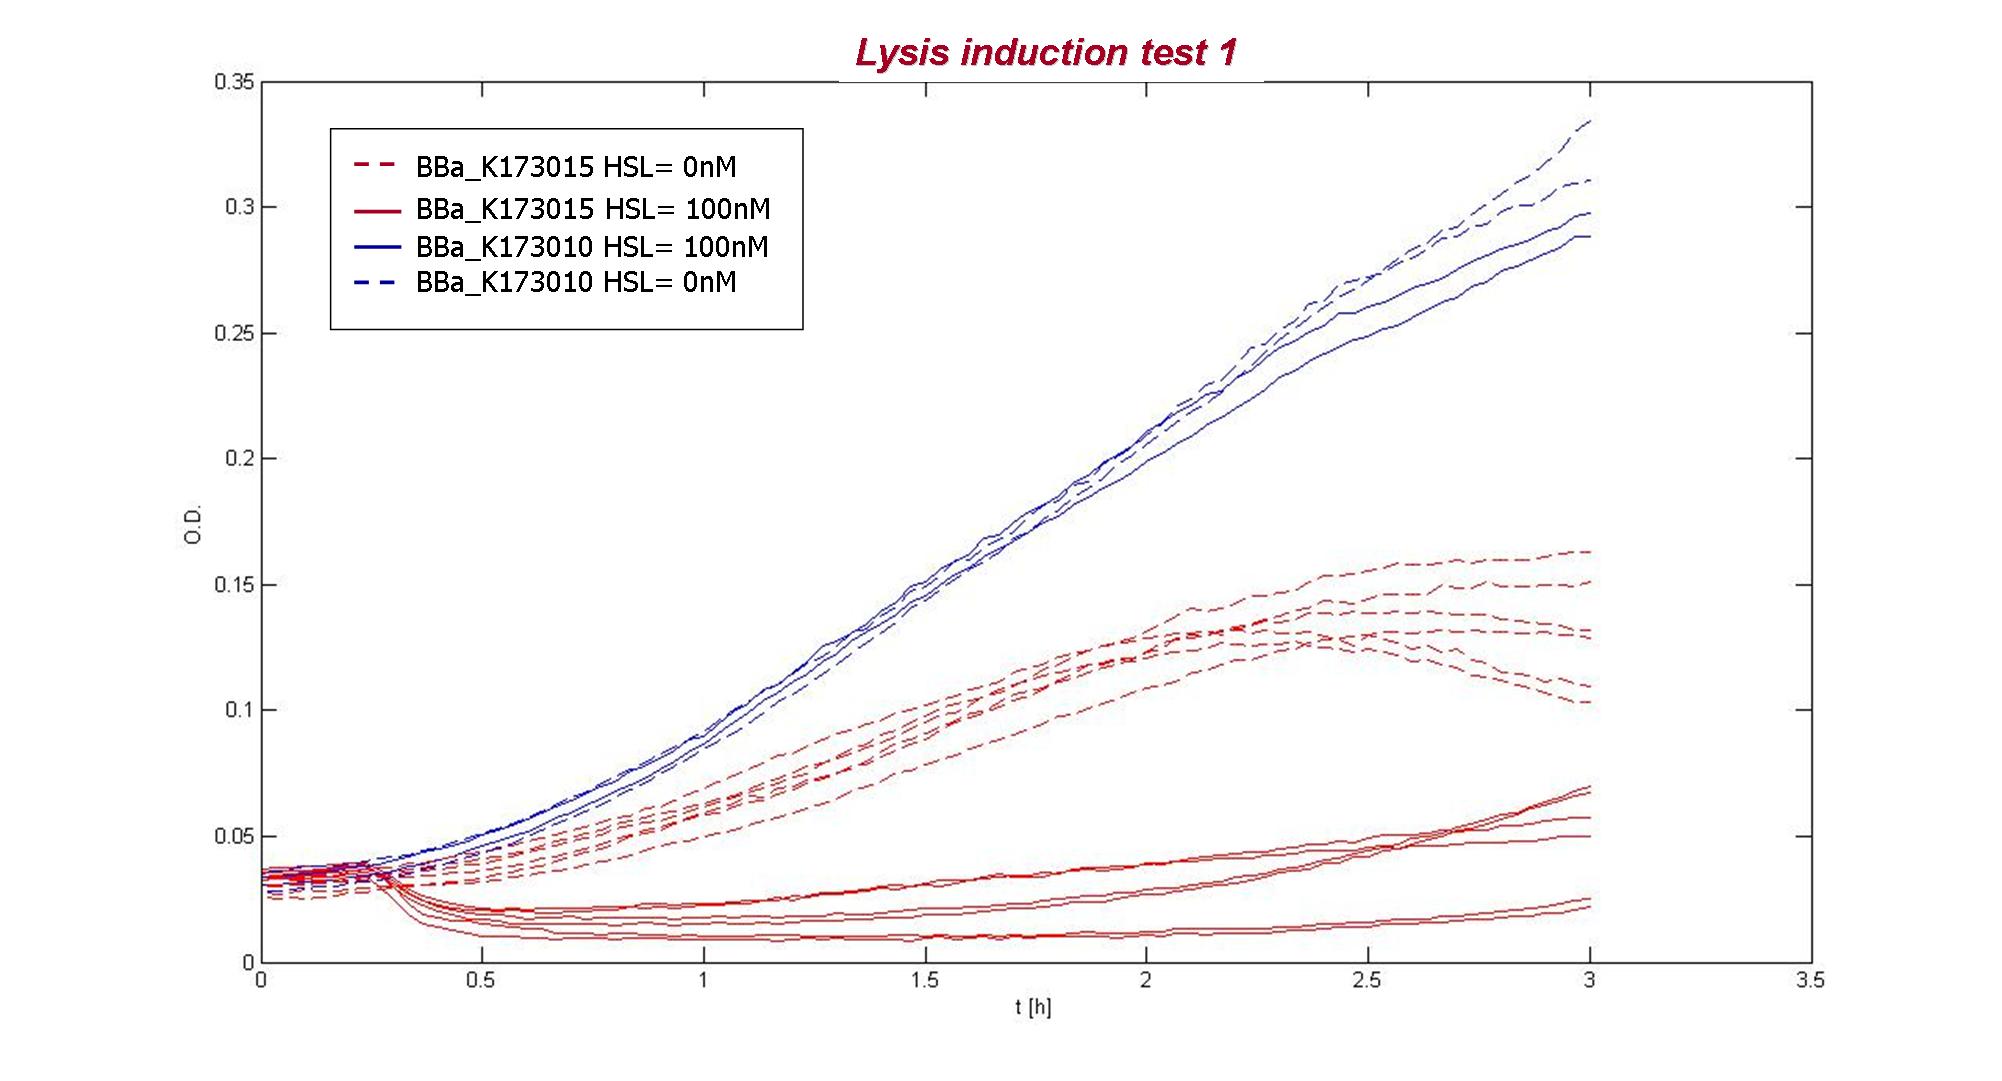 O.D.600 of two replicates of three colonies of BBa_K173015 (uninduced or induced with 100 nM 3OC6-HSL) and of BBa_K173010. |
The result showed that BBa_K173010 had comparable growth curves in presence of 3OC6HSL (dashed blue lines) or not (blue lines). The cultures containing the lysis device not induced (dashed red lines) shows a slow growth compared to BBa_K173010, maybe because of leakage of the inducible system causing a weak lysis or because the device decrease bacteria’s fitness. The culture containing the induced lysis device (red lines) shows a rapid decrease of O.D. after 15 minutes from induction, followed by a O.D. increasing. Different colonies had comparable dynamic growth.
This experiment has been repeated two times (data have not been reported): the first one (Experiment 2) lysis failed for unknown reasons, while in the second one (Experiment 3) it worked as in Experiment 1.
We deduced that the slow O.D. increase in lysed cultures (as well as the apparent genetic instability of the inducible device, which was unresponsive to 3OC6-HSL in Experiment 2) could be due to a positive selection of mutant cells unresponsive to 3OC6-HSL (or defective in the lysis device) or to the shortage of free 3OC6-HSL. To test this hypotheses, we performed a fourth, independent experiment, using BBa_K173015 inducible system, BBa_B0033 as a negative control and a culture containing only BBa_K112808 part (not functional because the operon lacks a promoter). The test has been performed with two different inducer concentrations (100 nM and 10nM) and following the standard protocol of Microplate reader experiments. In this experiment (Experiment 4), lysis was induced at t=0 and, in previously induced cultures, also after 4 hours of growth to test if they were still responsive to 3OC6-HSL.
 O.D.600 of BBa_K173015 (uninduced, induced with 10 nM 3OC6-HSL or 100 nM), of BBa_K173010 and of BBa_K112808. |
The growth curves of the second experiment are in agreement with the result of Experiment 1. Moreover, our hypothesis of mutant generation for BBa_K173015 induced culture is confirmed by the second induction: if the increase in O.D. was perhaps due to a shortage of 3OC6-HSL in the growing population, the second induction would have caused a new decline in O.D., which is not our case. This hypotesis is also confirmed by the growth curves of induced (at t=0) BBa_K173015 cultures, which show a decrease (from 15 min to 2 hours) followed by an increasing growth, comparable with the negative controls growth and faster than BBa_K173015 non induced cultures growth.
This new experiment also shows that both induction with 10nM or 100nM of 3OC6-HSL cause the same decrease in O.D. value and that K112808 part alone (green lines) could grow like the negative control, demonstrating that the slow growth of BBa_K173015 was actually due to leakage activity of BBa_F2620.
Conclusions
We built up a new measurement system to characterize a particularly interesting lysis device.
The reported results show that the lysis device works as expected when gene expression of the lysis genes is triggered. The performed experiments showed a genetic instability of this device (which was expected because a complete expression system of lysis genes is introduced in E. coli): in one of four experiments lysis could not be induced (Experiment 2) and in all the other experiments after lysis induction in BBa_K173015 cultures showed an O.D.600 decrease, followed by a fast increase, probably due to mutations in lysis expression system.
Growth conditions
Microplate reader experiments
- 8 ul of long term storage glycerol stock were inoculated in 5 ml of LB + suitable antibiotic in a 15 ml falcon tube and incubated at 37°C, 220 rpm for about 16 hours.
- The grown cultures were then diluted 1:100 in 5 ml of LB or M9 supplemented medium and incubated in the same conditions as before for about 4 hours.
- These new cultures were diluted to an O.D.600 of 0.02 (measured with a TECAN F200 microplate reader on a 200 ul of volume per well; it is not comparable with the 1 cm pathlength cuvette) in a sufficient amount of medium to fill all the desired microplate wells.
- These new dilutions were aliquoted in a flat-bottom 96-well microplate, avoiding to perform dynamic experiments in the microplate frame (see [http://2009.igem.org/Team:UNIPV-Pavia/Methods_Materials/Evaporation Frame effect section] for details). All the wells were filled with a 200 ul volume.
- If required, 2 ul of inducer were added to each single well.
- The microplate was incubated in the Tecan Infinite F200 microplate reader and fluorescence (when required) and absorbance were measured with this automatic protocol:
- 37°C constant for all the experiment;
- sampling time of 5 minutes;
- fluorescence gain of 50;
- O.D. filter was 600 nm;
- GFP filters were 485nm (ex) / 540nm (em);
- 15 seconds of linear shaking (3mm amplitude) followed by 10 seconds of waiting before the measurements in order to make a homogeneous culture.
- Variable experiment duration time (from 3 to 24 hours).
Materials
- Long term glycerol stocks were stored at -80°C with a final glycerol concentration of 20%
- Antibiotics were: Ampicillin (Amp) 100 ug/ml. It was stored at -20°C in 1000x stocks. Amp was dissolved in water.
- LB medium was prepare with: 1% NaCl, 1% bactotryptone, 0.5% yeast extract. The medium was not buffered with NaOH.
- 3OC6-HSL (Sigma) was dissolved in water and stored at -20°C in a 2mM stock.
User Reviews
Sequencing analysis of iGEM QC 2009 performed by UNIPV-Pavia team 2009
After the alignment of this BioBrick sequence from 2009 iGEM HQ quality contol with the theoretical sequence, many difformities have been reported (sequencing results have been taken from iGEM QC):
- the alignment showed several gaps in the scars;
- there is a silent point mutation in holin gene;
- the transcriptional terminator at the end of the sequence is actually K112710, not B0010.
However, the part should work properly because the regulatory parts and the amino acid sequence of the genes are correct. This has also been confirmed by functional tests (see Applications section).
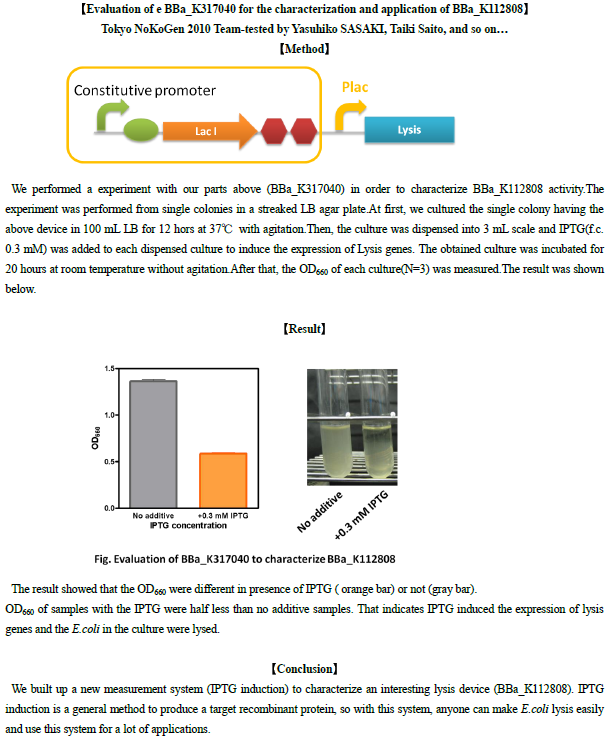
Evaluation of e BBa_K317040 for the characterization and application of BBa_K112808
Use in containment device
As we utilised the antiholin component of this cassette for assembly of our containment device Gene Guard, we have made antiholin available as a stand-alone BioBrick, available on the BBa_K515004 site. We have also added an insulator sequence, RBS and double terminator at the end.
Improvement made by Imperial iGEM 2011.
UNIQeaa923f26e5130dc-partinfo-00000022-QINU UNIQeaa923f26e5130dc-partinfo-00000023-QINU

 1 Registry Star